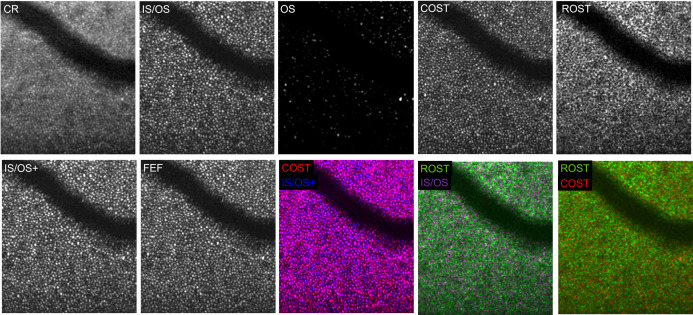
Fig 3. The different photoreceptor planes visualized with AO-OCT at 6.5°eccentricity.
The complete retina (CR plane) image integrates signals from all retinal layers, beginning with the ILM through the choroid. This unsegmented depiction is comparable to two-dimensional AO-FC and AO-SLO imaging and shows the cone mosaic with reduced contrast and strong background signals, in particular from the rods and the RPE. The inner segment outer segment junction (IS/OS plane) shows a dense pattern of hyper-reflective dots. The cone outer segments (OS plane) show only a few hyperreflective and some several weak signals without a distinct pattern. The signals of the cone outer segment tips (COST plane) appear smaller and better separable then the IS/OS. The signals of the rod outer segment tips (ROST plane) form a mottled network. The IS/OS+ plane combines signals from the IS/OS to the OS. While its appearance resembles mostly to the IS/OS, subtle difference between these two en-face projections can be found in S1 File. The full en-face image (FEF) projects all signals from the IS/OS to the COST and gives the most complete appearance of the cone mosaic, especially when compared to the CR plane. Additionally, three false-color composite images are shown: A false color-composite image of the COST (red) and IS/OS+ plane (blue) shows signal overlap (purple) in most but not all areas and noticeable variations of signal strength between the layers (blue and red signals). In contrast, false-color composite images of the of the ROST (green) and the IS/OS (purple) or the COST (red) show no relevant overlap (white or yellow) between cone and rod signals.

