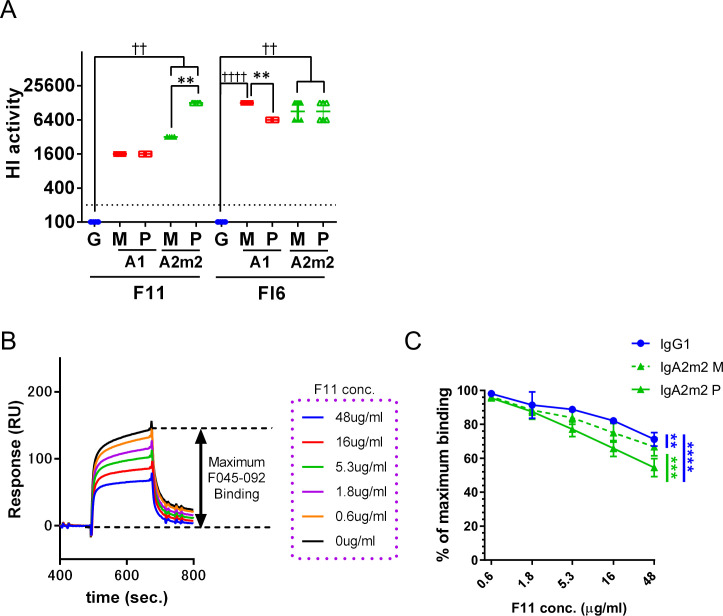
Fig 1. IgA polymers mask the hemagglutinin (HA) receptor binding site.
(A) The HI titer for each IgG1, monomeric (M) or polymeric (P) IgA1 (A1), and IgA2m2 (A2m2) antibody derived from clones F11 and FI6, tested against virus strain A/New Caledonia/20/1999 (H1N1, NC20). HI activity is presented in the scatter plots as the geometric mean, with the geometric standard deviation (SD) of six technical replicates. Y-axis values represent the HI titer, calculated as the 100,000/minimum concentration (μg/ml), which represents HI activity. Dotted lines represent the detection limit (y = 200; 500 μg/mL). **p < 0.01, comparing monomers with polymers (Mann–Whitney U test). ☨☨p < 0.01 and ☨☨☨☨p < 0.0001, comparing IgA monomers/polymers with IgG (Kruskal–Wallis test, followed by Dunn’s multiple comparison test). For statistical analysis, a provisional minimum HI activity value (y = 100; 1000 μg/mL) was applied to samples in which the HI activity was below the detection limit. (B) Schematic diagram showing RBS blockade, as assessed by SPR. First, recombinant HA from virus strain A/New Caledonia/20/1999 (H1N1) was bound to IgG1 or to monomeric or polymeric F11 IgA2m2. The amount of F045-092 IgG1 binding to F11-pre-bound HA was then measured to evaluate RBS blocking by F11. The relative response (RU) was acquired immediately after addition of F045-092 IgG1 (binding stability). The maximum stability value was acquired by measuring the RU immediately following binding of F045-092 IgG1 to free HA. (C) Binding of F045-092 IgG1 to F11 IgG1-, IgA2m2-, or IgA2m2-pre-bound HA. Y-axis values represent the ratio of F045-092 IgG1 binding to the maximum stability value. **p < 0.01, ***p < 0.001, and ****p < 0.0001 (two-way ANOVA).

