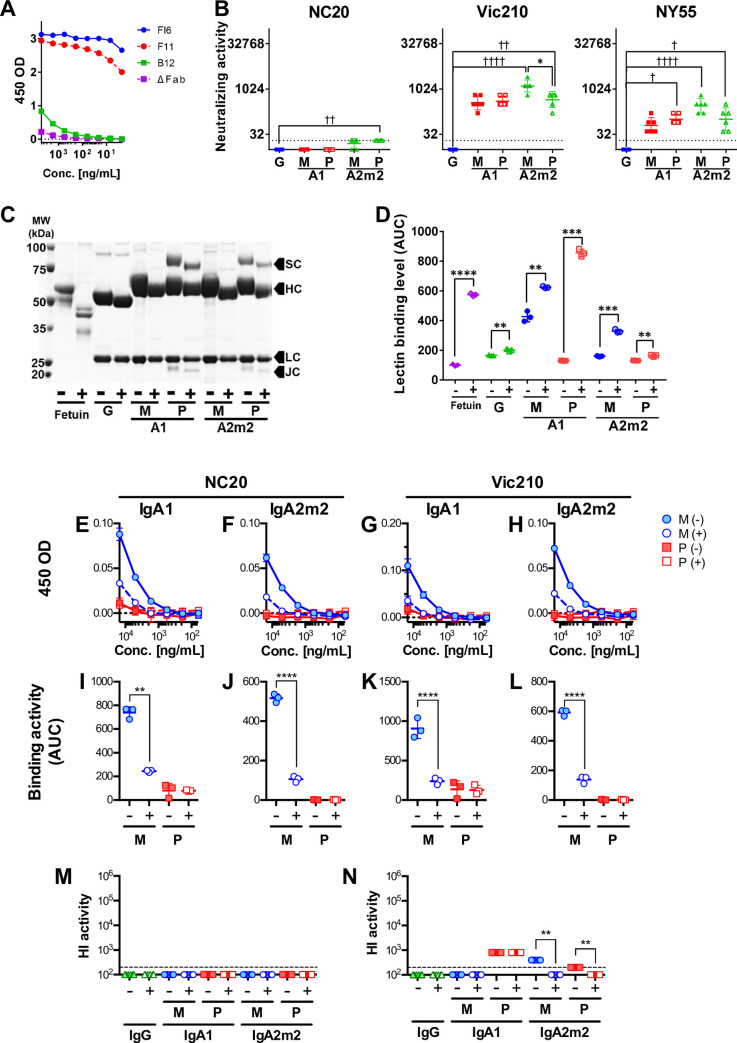
Fig 2. Deglycosylation of IgA antibodies and functional analyses of deglycosylated B12 IgA antibodies.
(A) Reactivity of FI6, F11, B12, and ΔFab monomeric IgA1 with the recombinant A/Brisbane/59/2007 (H1N1) HA stalk. (B) Virus neutralizing (NT) activity of IgG1, monomeric (M), or polymeric (P) IgA1 (A1), and monomeric (M) or polymeric (P) IgA2m2 (A2m2) derived from antibody clone B12 against virus strains A/New Caledonia/20/1999 (H1N1, NC20), A/Victoria/210/2009 (H3N2, Vic210), and A/New York/55/2004 (H3N2, NY55). NT activity is presented in the scatter plots as the geometric mean, with the geometric standard deviation (SD) from six technical replicates. Y-axis values represent neutralizing titers, calculated as 10,000/minimum concentration (μg/ml) of antibody that neutralized the virus. Dotted lines represent the detection limit (y = 20; 500 μg/mL). *p < 0.05, comparing monomers with polymers (Mann–Whitney U test). ☨p < 0.05, ☨☨p < 0.01, ☨☨☨☨p < 0.0001, comparing IgA monomers/polymers with IgG (Kruskal–Wallis test, followed by Dunn’s multiple comparison test). For statistical analysis, a provisional minimum NT activity value (y = 10; 1000 μg/mL) was applied to samples in which HI activity was below the detection limit. (C) SDS-PAGE analysis of monomeric (M) and polymeric (P) B12 IgG1 (G), IgA1 (A1), and IgA2m2 (A2m2) antibodies incubated with (+) or without (-) deglycosylation enzymes. Fetuin, the band for which shifted (i.e., a reduction in molecular weight) after deglycosylation, was used as positive control. All four components of secretory IgA antibodies (heavy chain [HC], light chain [LC], secretory component [SC], and the J chain [JC]) were observed. The heavy chain, secretory component, and J chain bands of IgA shifted down slightly (reduced molecular weight) after deglycosylation (D) Deglycosylation of samples was confirmed in an enzyme-linked lectin assay (ELLA). The area under the reactivity curve (AUC) was calculated from reactivity curves for lectin and each sample was treated in the presence (+) or absence (-) of deglycosylation enzymes. Data are expressed as the mean ± SD of three technical replicates. Treatment with deglycosylation enzymes led to a significant increase in lectin binding in all samples, suggesting successful deglycosylation. **p<0.01, ***p<0.001, and ****p<0.0001 (Welch’s test). (E–H) Reactivity of glycosylated (-) and deglycosylated (+) monomeric (M) and polymeric (P) B12 IgA1 (E and G) and IgA2m2 (F and H) antibodies with recombinant HA protein from the NC20 (E and F) and Vic210 (G and H) viruses. (I–L) AUC for each glycosylated (-) and deglycosylated (+) monomeric (M) and polymeric (P) B12 IgA1 (I and K) and IgA2m2 (J and L) antibody tested against the recombinant HA protein of the NC20 (I and J) and Vic210 (K and L) viruses. The AUC was calculated from the plots in E–H. Data are expressed as the mean ± SD of three technical replicates. Deglycosylation reduced the reactivity of B12 monomeric IgA1 and IgA2m2. **p < 0.01 and ****p<0.0001 (Welch’s test). (M and N) HI titer for each glycosylated (-) and deglycosylated (+) B12 IgG1 (G), monomeric (M), or polymeric (P) IgA1 (A1) and IgA2m2 (A2m2) antibody tested against virus strains NC20 (M) and Vic210 (N). HI activity is presented in the scatter plots as the geometric mean, with the geometric SD of three technical replicates. Y-axis values represent the HI titer, calculated as the 100,000/minimum concentration (μg/ml), which represents HI activity. Dotted lines represent the detection limit (y = 200; 500 μg/mL). **p < 0.01, comparing monomers with polymers (Mann–Whitney U test). For statistical analysis, a provisional minimum HI activity value (y = 100; 1000 μg/mL) was used for samples in which the HI activity was below the detection limit.

