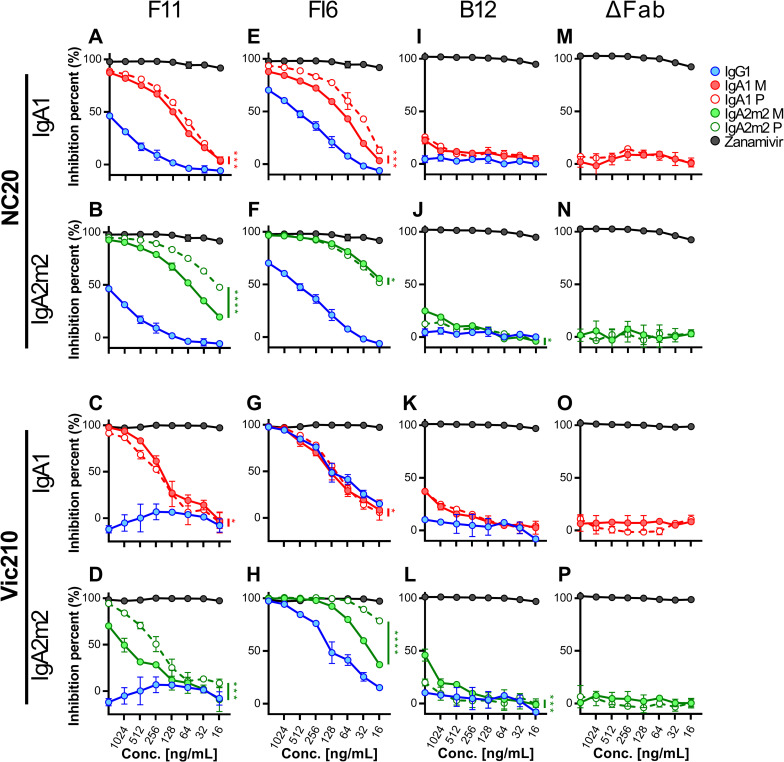
Fig 3. Comparison of the neuraminidase inhibition activity of IgG with that of IgA monomers and polymers.
Neuraminidase inhibition (NI) activity of IgG1, monomeric (M) or polymeric (P) IgA1, and monomeric (M) or polymeric (P) IgA2m2 derived from antibody clones F11 (A–D), FI6 (E-H), and B12 (I–L), as well as Fab-deficient (ΔFab) IgA antibodies (M–P), against virus strains A/New Caledonia/20/1999 (H1N1, NC20) (A, B, E, F, I, J, M, and N) and A/Victoria/210/2009 (H3N2, Vic210) (C, D, G, H, K, L, O, and P). NI activity is presented as inhibition curves, with each point and error bar representing the mean ± SD of three technical replicates. Y-axis values represent percentage inhibition of neuraminidase activity. The OD values of wells incubated without antibodies were normalized to y = 100, and the OD values of wells incubated without virus were normalized to y = 0. X-axis values represent the concentration of antibody added to each well. Zanamivir, a neuraminidase inhibitor, was used as a positive control. *p < 0.05, **p < 0.01, ***p < 0.001, and ****p < 0.0001, comparing monomers with polymers (two-way ANOVA).

