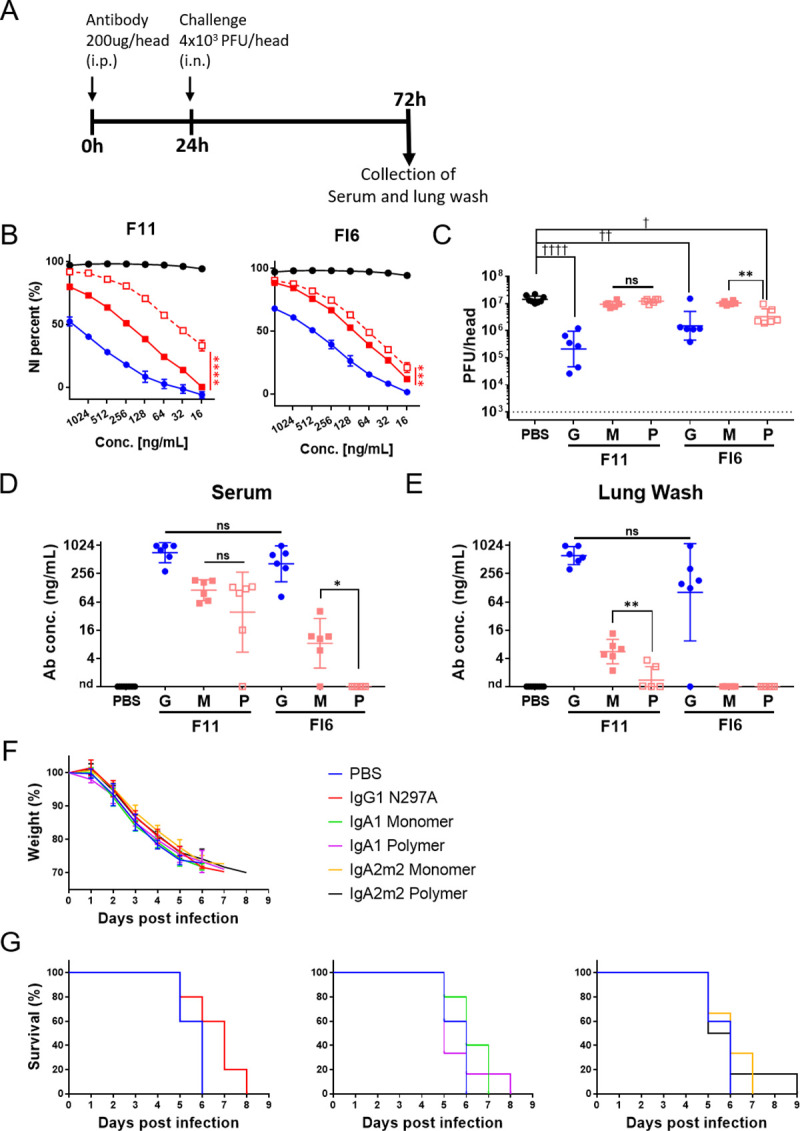
Fig 4. In vivo passive transfer of recombinant IgG and IgA antibodies to mice.

(A) Experimental schedule. Six-week-old female BALB/c mice (six per experimental condition) were injected intraperitoneally with IgG1 (G) or IgA1 monomers (M), with polymers (P) of F11 or FI6 antibodies (200 μg/200 μl per mouse), or with PBS (200 μl per mouse) 24 hours prior to challenge with virus. Next, mice received 4×10³ plaque-forming units (PFU) of mNRT virus administered intranasally via the left nostril (20 μl per mouse) to infect the lower respiratory tracts. At 3 days post-infection, lung wash samples were collected. (B) NI activity of IgG1 and monomeric or polymeric IgA1 derived from antibody clones F11 and FI6 against virus strain A/California/7/2009 (H1N1). NI activity is presented as inhibition curves, with each point and error bar representing the mean ± SD of three technical replicates. Y-axis values represent percentage inhibition of neuraminidase activity. The OD values for wells incubated without antibodies were normalized to y = 100, and those for wells incubated without virus were normalized to y = 0. X-axis values denote the concentration of antibody added to each well. Black line, Zanamivir; blue line, IgG1; red solid line, IgA1 monomer; red dotted line, IgA1 polymer. ***p < 0.001 and ****p < 0.0001, comparing monomers with polymers (two-way ANOVA). (C) Virus titers in lung wash samples collected at 3 days post-infection. Virus titers are presented in scatter plots as the geometric mean, with the geometric SD. Y-axis values represent plaque-forming units (PFU)/mouse, which is equal to PFU/2mL of lung wash, as calculated from the results of the plaque assay. The dotted line denotes the detection limit (1000 PFU/mouse). **p< 0.01, comparing monomers with polymers (Mann–Whitney test). ☨p< 0.05, ☨☨p< 0.01, and ☨☨☨☨p< 0.0001, comparing IgA monomers/polymers with IgG (Kruskal–Wallis test, followed by Dunn’s multiple comparison test). (D, E) Antibody concentrations in serum (D) and lung wash (E) samples collected at 3 days post-infection. Antibody concentrations are expressed on scatter plots as the geometric mean, with the geometric SD. *p< 0.05 and **p< 0.01, comparing monomers with polymers (Mann–Whitney test). For statistical analysis, a provisional antibody concentration (1 ng/mL) was applied to samples in which antibody concentrations were below the detection limit. ns: not significant, nd: not detected. (F) Body weight changes in 6-week-old female BALB/c mice (five or six per experimental condition) following lethal infection with mNRT virus. Mice were injected intraperitoneally with IgG1 harboring the N297A mutation (IgG1 N297A), gA1/IgA2m2 monomers, polymers of FI6 antibodies (200 μg/200 μl per mouse), or PBS (200 μl per mouse) 2 hours prior to challenge with virus. Next, mice received 4 × 10³ plaque-forming units (PFU) of mNRT virus intranasally via the left nostril (20 μl per mouse) to infect the lower respiratory tract. The body weight of each mouse was normalized to that at Day 0 (the date of virus infection; y = 100). (G) Survival of mice following lethal virus infection. The survival curves for the groups receiving IgG1 N297A (left), IgA1 (middle), and IgA2m2 (right) are shown in different panels, with the survival curve of the PBS administered group used as the negative control.
