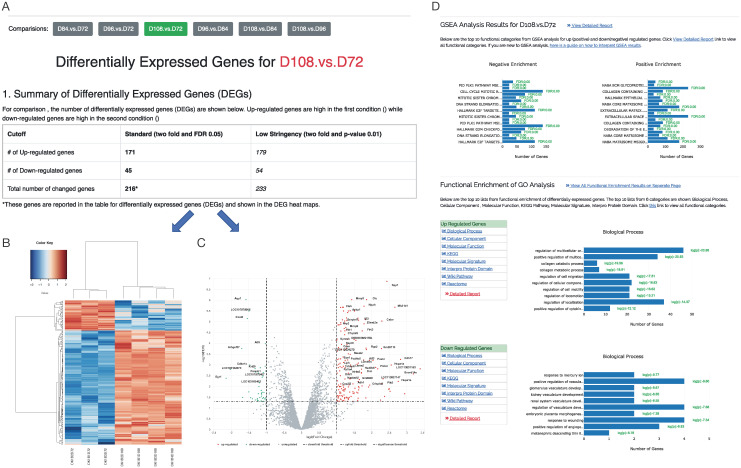
Fig 3. The outputs from differential gene expression and pathway enrichment analysis.
(A) Differential expression analysis identified DEGs from the comparison between group D108 and D72 and are plotted in (B) heatmap and (C) volcano chart. (D) Pathway enrichment analysis showed the top 10 significant pathways from multiple databases enriched by DEGs.

