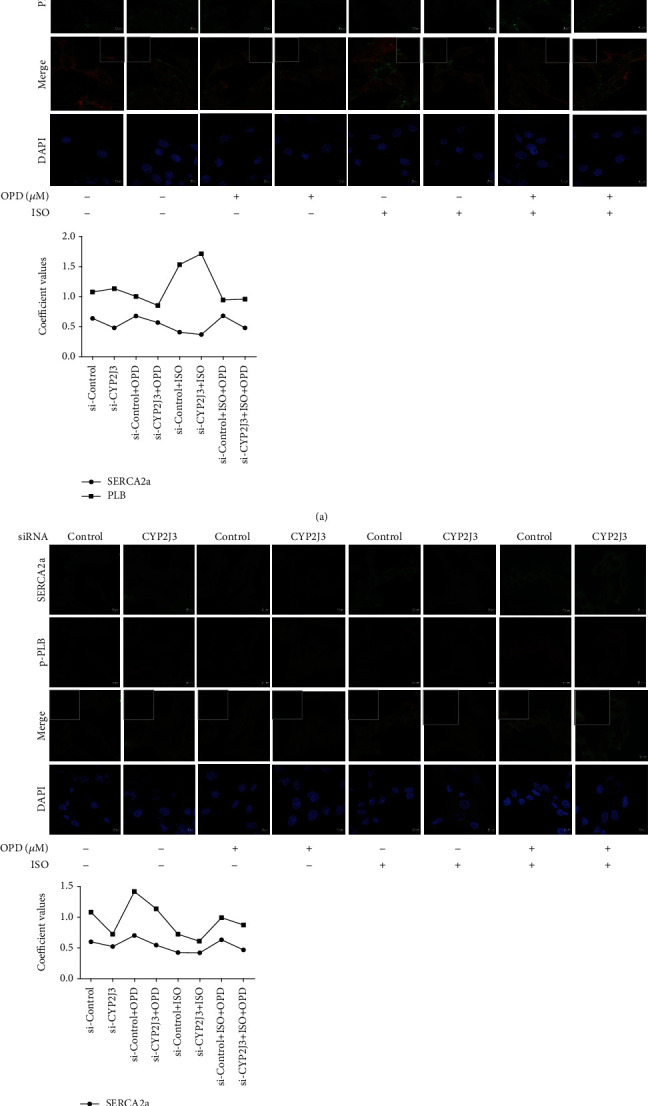
Figure 4.

OPD induced SERCA2a colocalization of SERCA2a and p-PLB through CYP2J3 in H9c2 cells. Cells were transfected with CYP2J3 siRNA for 24 h. ISO and OPD were administrated as mentioned above. (a) Images showing immunofluorescence of SERCA2a (red) and PLB (green) proteins in H9c2 cells and changes of their colocalization. An embedded scattergram estimated the amount of each detected antigen based on colocalization. Colocalized pixels of yellow color are located along the diagonal of the scattergram. Compared with the NC group, the green (PLB) intensity increased in the Si-CYP2J3 group while the red (SERCA2a) intensity decreased. The OPD-treated si-CYP2J3 group showed decreased PLB intensity compared with the OPD-treated NC group. (b) Images showing immunofluorescence of SERCA2a (green) and p-PLB (red) proteins in H9c2 cells and changes of their colocalization pattern following OPD (1 μmol/L) and ISO (1 μmol/L) administration as mentioned above. An embedded scattergram estimated the amount of each detected antigen based on colocalization. Colocalized pixels of yellow color are located along the diagonal of scattergram. Compared with the NC group, the red (p-PLB) intensity decreased in the si-CYP2J3 group. The OPD-treated si-CYP2J3 group showed increased p-PLB intensity compared with the OPD-treated NC group.
