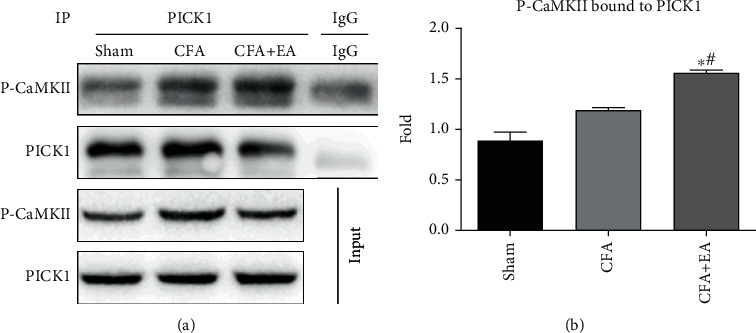
Figure 3.

Effects of EA on the formation of pCaMKII-PICK1 complex. (a) Representative western blot images of P-CaMKII and PICK1 by CO-IP. (b) Statistical analysis of pCaMKII-PICK1 complex. Results represent the mean ± SEM (n = 4/group). ∗P < 0.05 vs. sham group; #P < 0.05 vs. CFA group.
