
Figure 1.
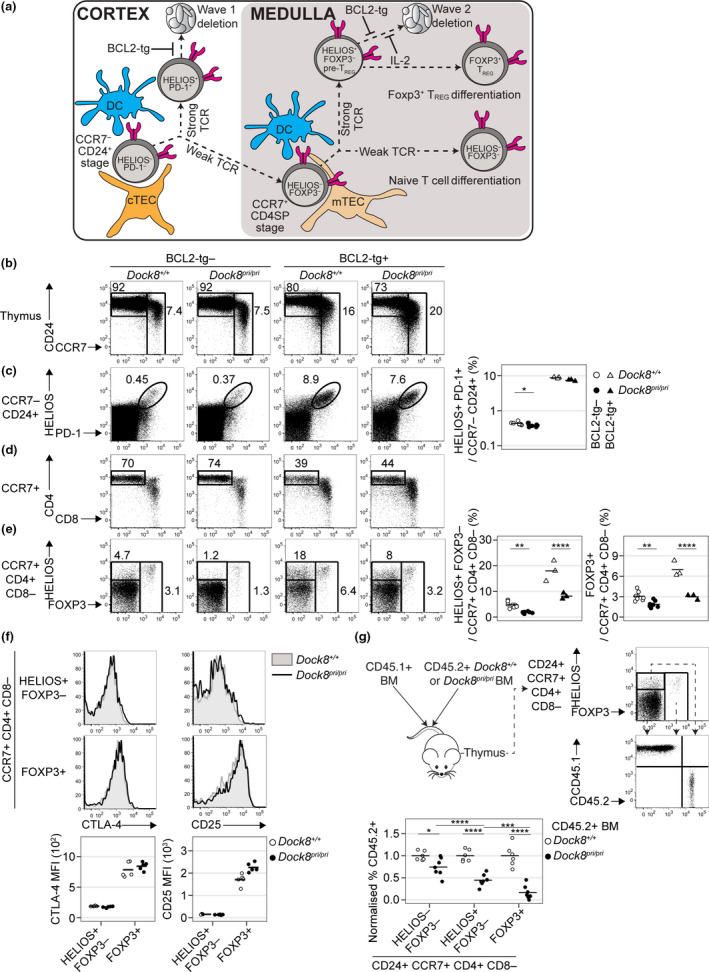
DOCK8 deficiency perturbs tolerance induction in CCR7+ CD4SP thymocytes. (a) Approach to the quantification of thymic tolerance. Cortical thymic epithelial cells (cTEC) and DC induce a subset of strongly self‐reactive immature CCR7− CD24+ thymocytes to upregulate Helios and PD‐1 before undergoing apoptosis (wave 1 deletion). Upon encountering medullary thymic epithelial cells (mTEC) and DC at the subsequent CCR7+ CD4SP stage, strong TCR signalling induces additional thymocytes to upregulate Helios to produce Helios+ Foxp3− pre‐TREG that are poised for apoptosis (wave 2 deletion) or Foxp3 upregulation (TREG differentiation). Foxp3 upregulation marks the onset of the requirement for IL‐2 to inhibit wave 2 deletion. BCL2‐tg expression inhibits apoptosis, enabling measurement of the scale of wave 1 deletion and wave 2 deletion. Thymocytes that undergo weak TCR signalling at both stages differentiate into naïve T cells. (b) CD24/CCR7 phenotype of thymocytes from mice with the indicated genotypes (top) with a gate for the CD24+ CCR7− population, which was analysed for (c) Helios and PD‐1 expression to enumerate the Helios+ PD‐1+ subset (right). (d) CD4/CD8 phenotype of CCR7+ thymocytes, with a gate for the CD4SP population, which was (e) analysed for Helios and Foxp3 expression to enumerate the Helios+ Foxp3− and Foxp3+ subsets (right). Data in c and e were compiled from two independent experiments with n = 8 Dock8+/+, n = 8 Dock8pri/pri, n = 3 Dock8+/+BCL2‐tg+ and n = 3 Dock8pri/priBCL2‐tg+ mice. (f) Histogram overlays show CTLA4 (left) and CD25 (right) expression on the Helios+ Foxp3− and Foxp3+ subsets of CCR7+ CD4SP thymocytes in concatenated FACS files from a single experiment. Black line represents Dock8pri/pri and grey shading Dock8+/+ littermate controls. Graphs (below) show mean fluorescence intensities (MFI) for n = 5 mice per group, representative of two independent experiments. (g) Irradiated mice were reconstituted with 50:50 mixtures of CD45.1 wild‐type BM plus CD45.2 Dock8+/+ BM or CD45.2 Dock8pri/pri BM eight weeks before analysis. Plots show CD24+ CCR7+ CD4SP thymocytes divided into three subsets based on Helios and Foxp3 expression, each of which was analysed for the frequency of CD45.2+ cells. To facilitate statistical comparisons, the frequency of CD45.2+ cells in each CCR7+ CD24+ CD4SP subset was divided by the frequency of CD45.2+ cells at the precursor CD4+ CD8+ double‐positive stage in the same sample, then divided by the mean of the Dock8+/+ group for each subset. Transplants were performed on a single day, and chimeric mice were analysed in two separate experiments with concordant results. Results for one experiment with n = 6 CD45.1 WT/CD45.2 Dock8+/+ BM recipients and n = 7 CD45.1 WT/CD45.2 Dock8pri/pri BM recipients are shown. Each symbol represents a measurement from 1 mouse, and horizontal bars show the group mean. Statistical analyses used 2‐way ANOVA with Sidak’s multiple comparisons test. P‐values: * < 0.05, ** < 0.01, *** < 0.001 and **** < 0.0001.