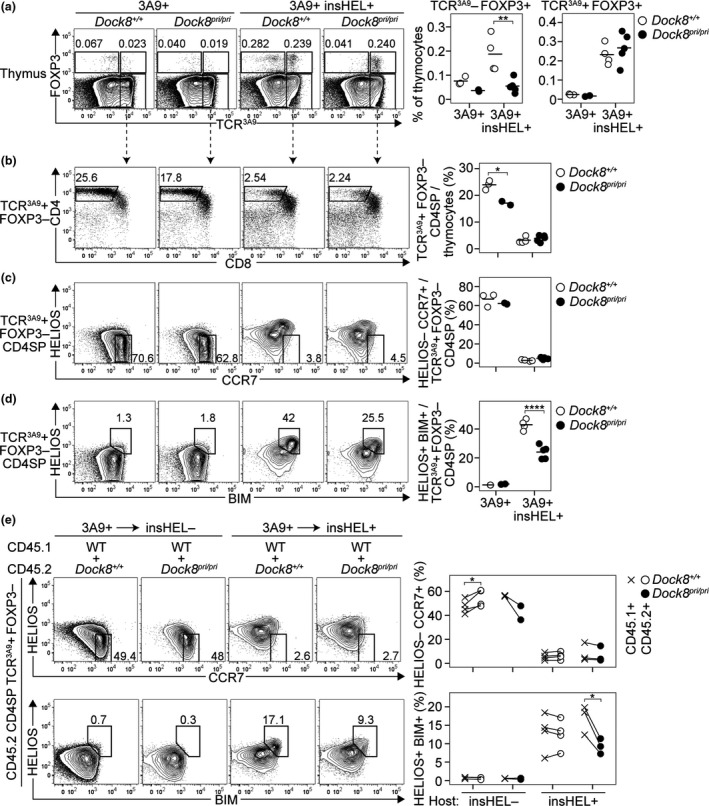
Figure 2.

DOCK8 is not required for deletion of strongly self‐reactive CD4SP thymocytes. For thymocytes from mice of the indicated genotypes (top), plots show (a) expression of Foxp3 versus TCR3A9 with numbers representing the percentage of cells in the adjacent gate, enumerated in the summaries (right). (b) CD4/CD8 phenotype of TCR3A9+ Foxp3− thymocytes with a summary showing the percentage of TCR3A9+ Foxp3− CD4SP cells among all thymocytes (right). TCR3A9+ Foxp3− CD4SP thymocytes were analysed for (c) Helios/CCR7 phenotype, with a gate for antigen‐inexperienced Helios− CCR7+ cells, and (d) Helios/Bim phenotype, with a gate for antigen‐experienced Helios+ Bim+ cells, enumerated in the summaries (right). In a–d, each symbol in a summary graph represents a measurement from 1 mouse (n = 3 Dock8+/+3A9+, n = 2 Dock8pri/pri3A9+, n = 4 Dock8+/+3A9+insHEL+ and n = 5 Dock8pri/pri3A9+insHEL+), and horizontal bars show the group mean compiled from 2 experiments. (e) Mixed chimeras made by reconstituting irradiated insHEL− or insHEL+ hosts with mixtures of CD45.1 wild‐type 3A9+ BM plus CD45.2 Dock8+/+ or Dock8pri/pri 3A9+ BM were analysed 8 weeks after BM transplantation. Plots show CD45.2+ TCR3A9+ Foxp3− CD4SP thymocytes analysed for Helios/CCR7 (top) or Helios/Bim (bottom) phenotypes, with summaries (right) showing the frequency of subsets gated on the plots. Each line joins frequencies for the CD45.1+ and CD45.2+ subsets of TCR3A9+ Foxp3− CD4SP thymocytes from an individual mouse (n = 4 CD45.1Dock8+/+: CD45.2 Dock8+/+ into insHEL−; n = 2 CD45.1Dock8+/+: CD45.2 Dock8pri/pri into insHEL−; n = 4 CD45.1Dock8+/+: CD45.2 Dock8+/+ into insHEL+; and n = 3 CD45.1Dock8+/+: CD45.2 Dock8pri/pri into insHEL+). Statistical analyses used 2‐way ANOVA with Sidak’s multiple comparisons test (a–d) or paired Student’s t‐tests (e); P‐values: * < 0.05, ** < 0.01 and **** < 0.0001.
