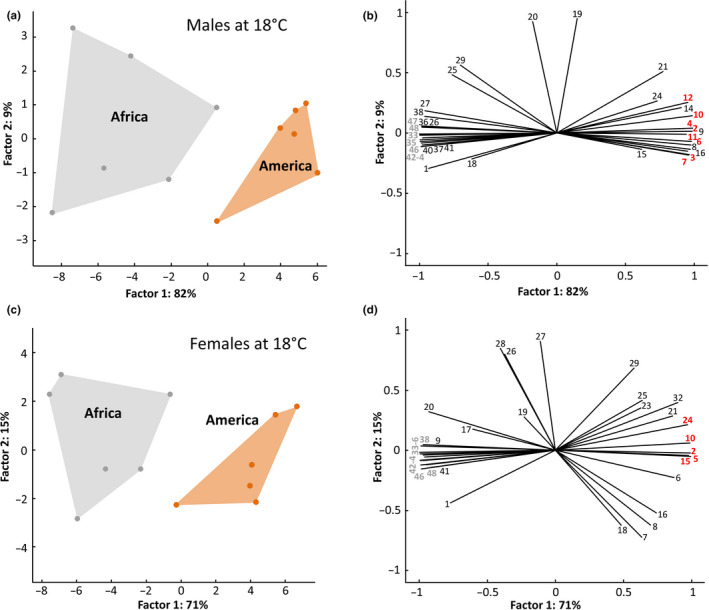
Figure 5.

Comparison of quantitative patterns of CHCs between males (a, b) and between females (c, d) from African and American populations, held at 18°C. Numbering of CHCs corresponds to that in Table 1. (a & c) Projection of PCA factor scores. (b & d) Variable correlations with the first two PCA factors. Variables in bold were retrieved as among the most correlated with the CCA model using temperature as a categorical predictor in the PCA analysis (red = American population, gray = African population)
