FIGURE 2.

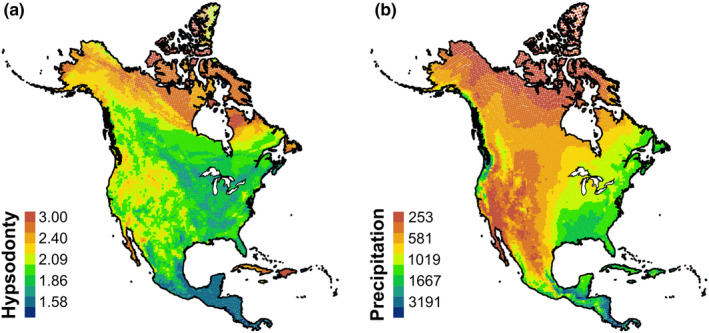
Data used in this study. Legend values are the maximum values for the bin. (a) Mean community hypsodonty values; (b) mean annual precipitation in log mm

Data used in this study. Legend values are the maximum values for the bin. (a) Mean community hypsodonty values; (b) mean annual precipitation in log mm