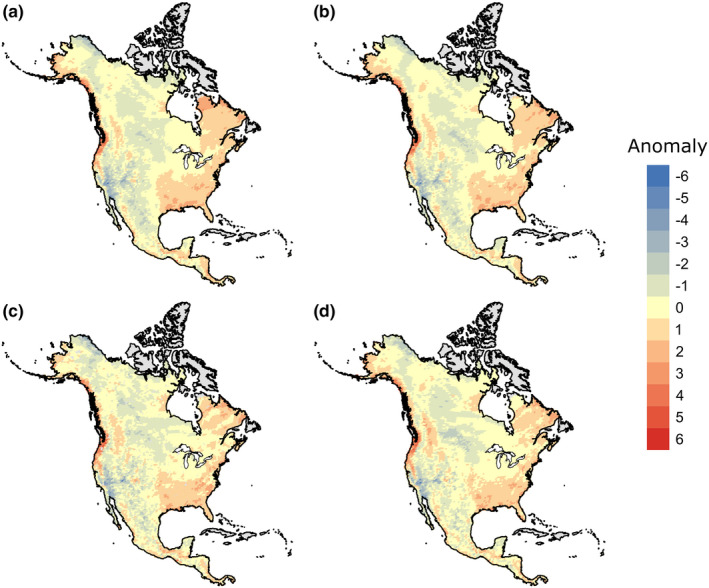
FIGURE 3.

Anomaly maps of differences between observed and estimated precipitation from four estimation methods. (a) linear regression; (b) polynomial regression; (c) nearest neighbor; and (d) maximum likelihood. Scale is log mm and values are the mean of each color bin
