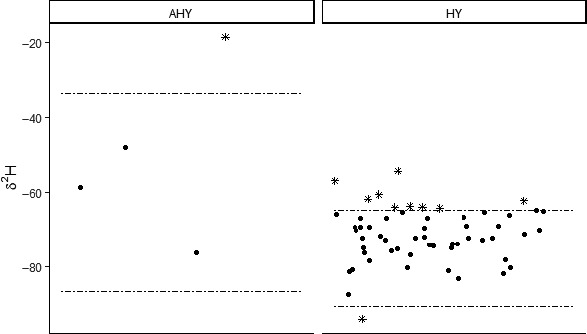
FIGURE 3.

δ2H values for flammulated owls of unknown breeding origin trapped during the fall, separated by after‐hatch‐year (AHY; n = 4) and hatch‐year (HY; n = 57). Horizontal dashed lines represent the 95% prediction intervals of distributions parameterized based on estimates derived from δ2H values of known‐local owls for AHY (n = 8) and HY owls (n = 17), respectively. The δ2H values of most (50 of 61) unknown‐origin owls fell within the 95% prediction intervals of the local distributions (circles) with only 11 of 61 owls falling outside of the intervals (asterisks)
