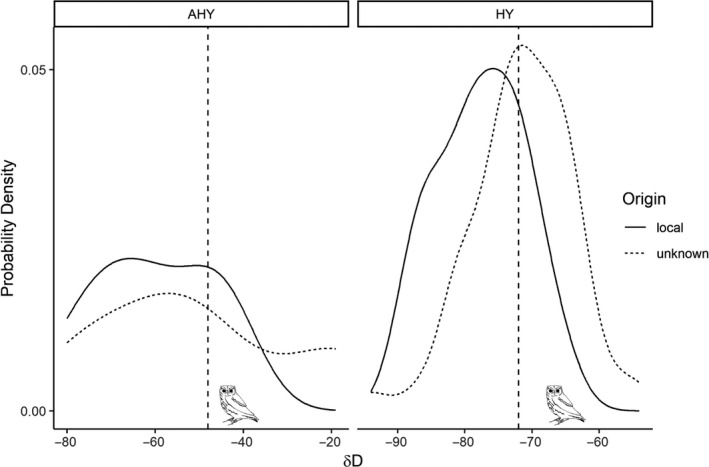
FIGURE 4.

Distribution of δ2H values for known‐local (solid) and unknown‐origin (dashed) individuals, separated by age classes into AHY owls (left panel) and HY owls (right panel). Measured δ2H for two fall‐captured owls, recaptured as putative residents, are plotted over the distributions (vertical dashed lines): an AHY owl with measured δ2H of −48 and a HY owl with measured δ2H of −72
