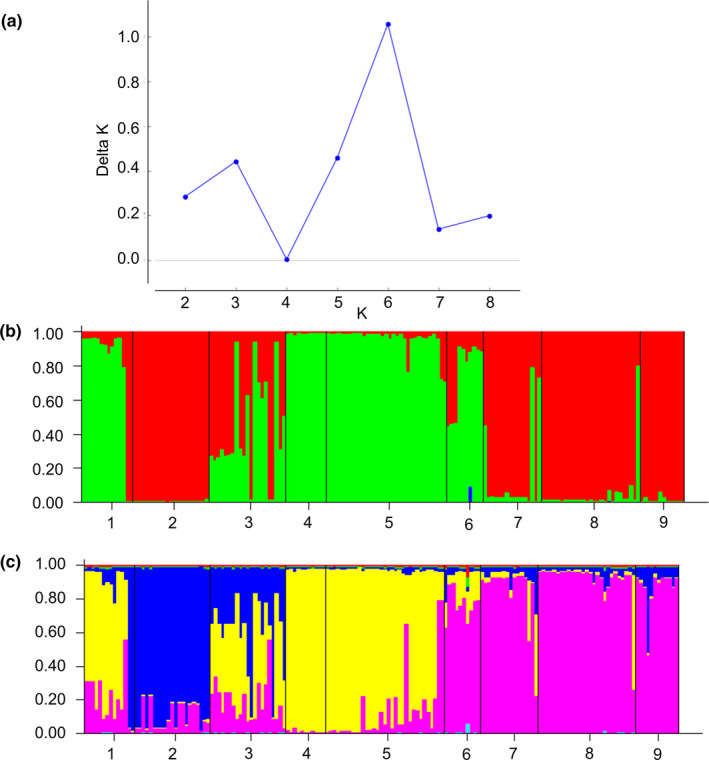
FIGURE 4.

Structure of D. antarctica populations revealed by Bayesian analysis implemented in Structure. (a) Change (delta K) in likelihood for K = 1–9 (Evanno et al., 2005). (b) Individual probability assignment of each of the individuals sampled from 9 populations for K = 3. (c) Individual probability assignment of each of the individuals sampled from 9 populations for K = 6. Each individual is represented by a vertical bar broken into different colored genetic clusters, with length proportional to probability of assignment to each cluster
