FIGURE 5.

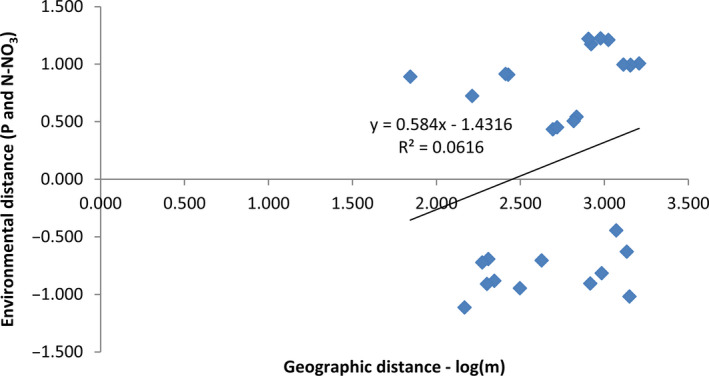
IBE analysis. The Mantel test scatterplot shows environmental distance (standardized to mean of zero and a standard deviation of one) as a function of logarithm of geographic distance

IBE analysis. The Mantel test scatterplot shows environmental distance (standardized to mean of zero and a standard deviation of one) as a function of logarithm of geographic distance