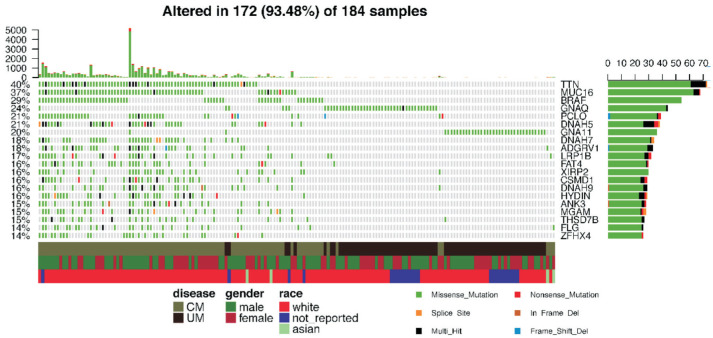
Figure 3. Top 20 most frequently mutated genes in the combined group of CM and UM.
The upper histogram shows the variants' counts per sample. The percentiles at the left border of the main heatmap mean the occurrence ratio of each gene mutation. The right horizontal histogram presents the variant classifications of each gene. The covariate tracks show clusters for disease, gender, race and variant classification type.

