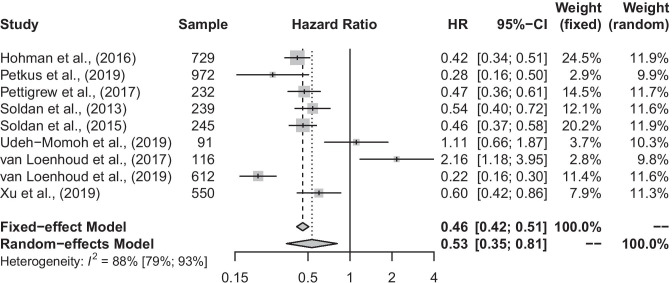
Fig. 2.
Forest plot conveying the risk of progression to MCI or all-cause dementia. Petkus et al. (2019), Pettigrew et al. (2017), Soldan et al. (2015), and van Loenhoud et al. (2017; 2019) controlled for structural indicators of Alzheimer’s disease such as hippocampal volume. Hohman et al. (2016), Soldan et al. (2013), and Udeh-Momoh et al. (2019) controlled for biomarkers of Alzheimer’s disease such as Aβ or tau. Further, Hohman et al. (2016), Petkus et al. (2019), and van Loenhoud et al. (2017; 2019) examined cognitive reserve using the residual variance approach, whereas Pettigrew et al. (2017), Soldan et al. (2013; 2015), Udeh-Momoh et al. (2019), and Xu et al. (2019) used the composite proxy approach

