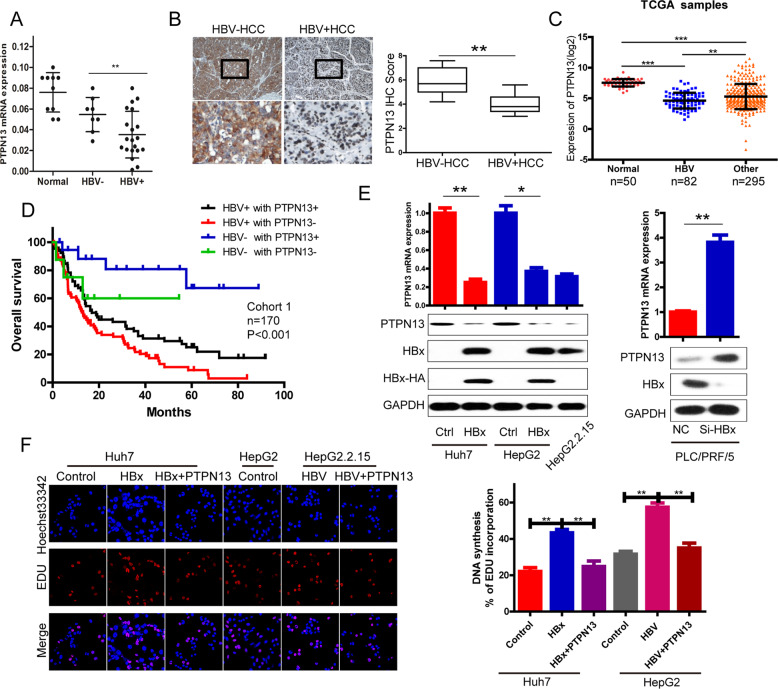
Fig. 1. HBx promotes cell proliferation and downregulates PTPN13 expression.
A qRT-PCR analysis of PTPN13 mRNA levels in 10 normal liver tissue samples, 8 HBV-HCC tissue samples and 20 HBV + HCC tissue samples normalized to GAPDH expression. B Left: PTPN13 expression was determined by IHC staining. Representative images of a subset of the tumor specimens are shown. The lower panel shows magnified views (4×), shown in boxes in the upper panel. Right: IHC scores for PTPN13 in the two groups are summarized. C The expression levels of PTPN13 were analyzed according to patient HBV positivity. Data are shown after a log2 transformation. D Kaplan–Meier survival curve analysis in HCC patients stratified by the combination of the HBV status and PTPN13 expression is shown. E The effects of transient HBx overexpression in Huh7 and HepG2 cells, HepG2.2.15 cells (integration of the HBV genome) and HBx knockdown with siRNA in PLC/PRF/5 cells (derived from HBV-infected liver) on the mRNA and protein expression levels of PTPN13. F DNA synthesis in stable HBx-overexpressing cells with transient PTPN13 overexpression and stable HBV-overexpressing HepG2.2.15 cells with transient PTPN13 overexpression, as measured by an EdU assay. The data represent the mean ± standard deviation (SD) of three independent experiments (*P < 0.05, **P < 0.01, and ***P < 0.001 compared with the respective control).

