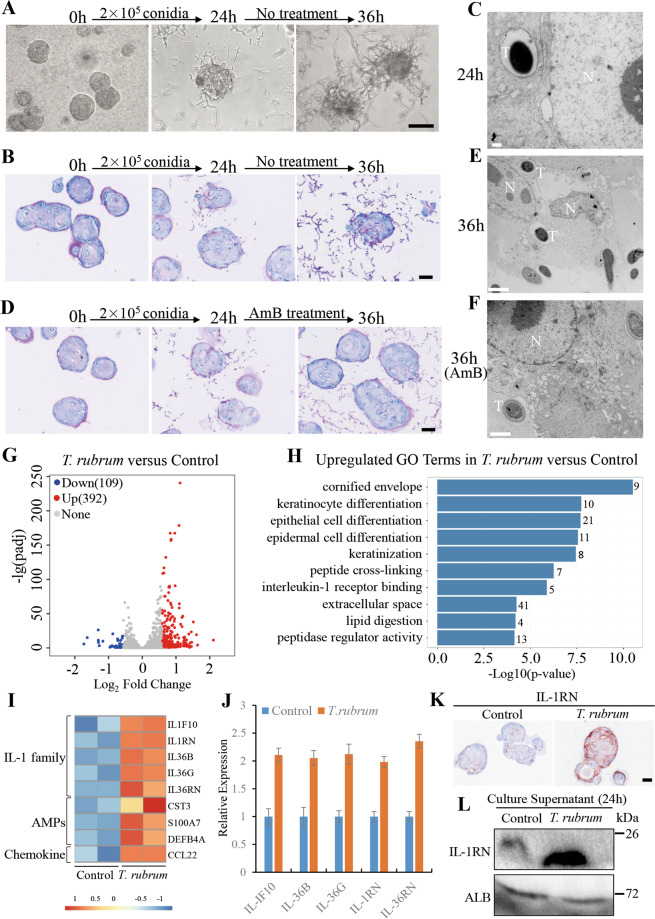
Fig. 7. Modeling dermatophytosis in hPEOs.
A Phase-contrast images showing progression of fungal elements on hPEOs infected by T. rubrum conidia over time. B Periodic-Acid Schiff (PAS) staining of infected hPEOs without antibiotic treatment. C The TEM of infected hPEOs after 24 h. D PAS staining of infected hPEOs with antibiotic treatment from 24 h. E, F The TEM of infected (E), antibiotic-treated (F) hPEOs after 36 h. G Volcano plot showing differential expression of host genes between T. rubrum-infected and control hPEOs at 24 h. Each dot represents a gene. The red and blue dots represent differentially expressed genes with P < 0.05. H GO analyses of upregulated genes in T. rubrum group versus control group. I Heatmap showing the expression of induced innate immunity-related genes. J qRT–PCR analysis of the expression of genes belonging to IL-1 receptor binding in T. rubrum group and the controls. K Immunohistochemical staining for IL-1RN in hPEOs of T. rubrum group and the controls. L Secretion lever of IL-1RN in culture supernatant of T. rubrum group and the control group at 24 h. AmB: amphotericin B. Scale bar: 100 μm (A), 50 μm (B, D, and K), 0.5 μm (C), 2 μm (E, F).

