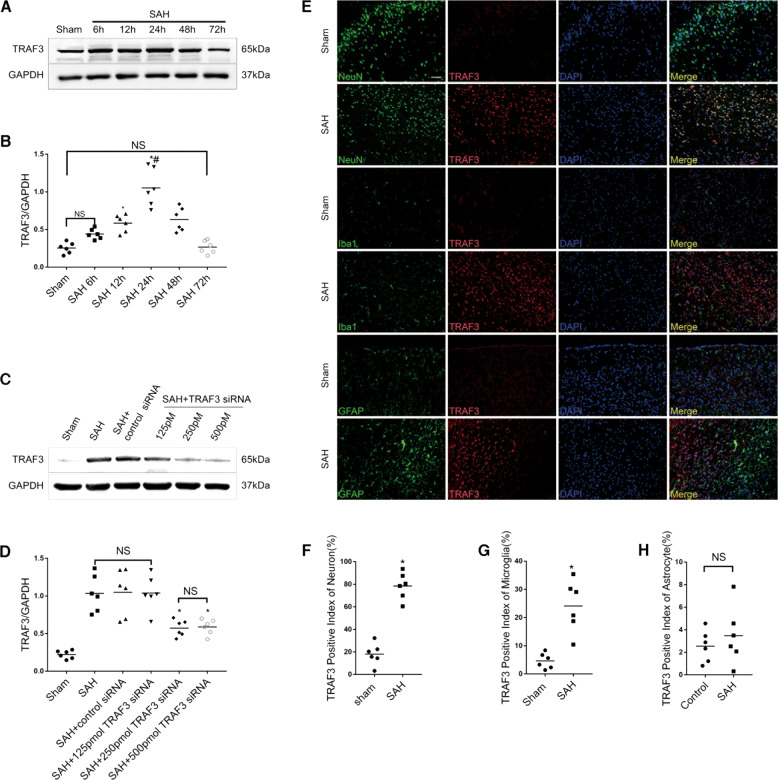
Fig. 2. Expression and cellular distribution of TRAF3 and the effect of TRAF3 siRNA on TRAF3 expression in SAH model.
A Western blotting analysis revealed that TRAF3 expression levels increased post-SAH. B Quantitative analysis of TRAF3/GAPDH. N = 6 mice per group. *p < 0.05 versus the sham group, #P < 0.05 versus the SAH 48 h group. C, D Western blotting analysis revealed that the expression of TRAF3 in SAH + 125 pmol of TRAF3 siRNA group showed no significant change compared with SAH + control siRNA group. However, 250 and 500 pmol of TRAF3 siRNA significantly reduced the TRAF3 expression. GAPDH served as a loading control. N = 6 mice per group. *p < 0.05 versus the SAH group. E Representative double immunofluorescence images showed that TRAF3 expression was elevated 24 h following SAH and was mainly expressed in neurons, with sparse expression in microglia and no expression in astrocytes. Scale bar: 50 μm. The TRAF3 positive index of neurons (F), microglia (G), and astrocytes (H). N = 6 mice per group. *p < 0.05 versus the sham group.

