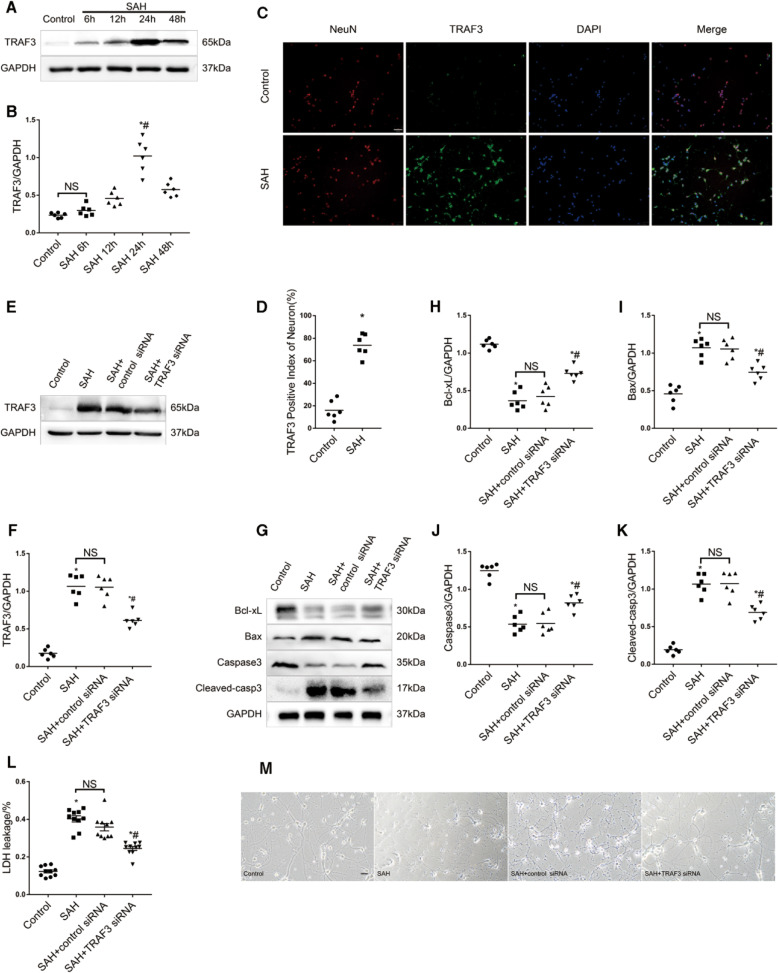
Fig. 5. TRAF3 expression was increased and TRAF3 siRNA could alleviate neuronal apoptosis in vitro.
Western blotting analysis represented that the level of TRAF3 increased significantly at 24 h following SAH (A, B). N = 6 wells per group. *p < 0.05 versus the control group, #p < 0.05 versus the SAH 48 h group. C, D Overlapped images with TRAF3 and NeuN demonstrated that TRAF3 expression was elevated after SAH. Scale bar: 50 μm. N = 6 wells per group. *p < 0.05 versus control group. E, F Western blotting analysis showed that the level of TRAF3 could be downregulated via TRAF3 siRNA after SAH. N = 6 wells per group. *p < 0.05 versus the control group, #p < 0.05 versus the SAH group. G Representative western blot images and quantitative analyses showed that downregulation of TRAF3 increased the expression of Bcl-xL (H), Caspase-3 (J) and decreased the expression of Bax (I) and C Hayakawa leaved caspase-3 (K) compared to SAH and SAH + control siRNA groups. N = 6 wells per group. *p < 0.05 versus the control group, #p < 0.05 versus the SAH group. L LDH release rates demonstrated that TRAF3 siRNA treatment decreased LDH release rates compared to SAH and SAH + control siRNA groups. N = 10 wells per group. Data represent mean ± SEM. *p < 0.05 versus the control group, #p < 0.05 versus the SAH group. M Light microscopy of neurons revealed the decrease of neuronal synapses and cell shrinkage was rescued via downregulating TRAF3. N = 3 wells per group. Scale bar: 20 μm.

