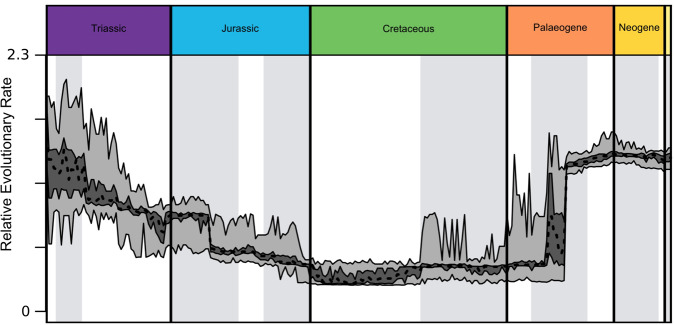
Fig. 2. Time-series representation of evolutionary rates.
Rate values were output by a variable rate phylogenetic model implemented using BayesTraits. The taxa included in each 1-million-year interval are denoted using a phylogenetic tree, dated using using first and last appearance dates. The taxa sampled in each 1-million-year interval were bootstrapped. Each bootstrap corresponded to a random 50% sample of the data in each bin, repeated 100 times. The interquartile range is shown in dark grey, the total range in light grey.

