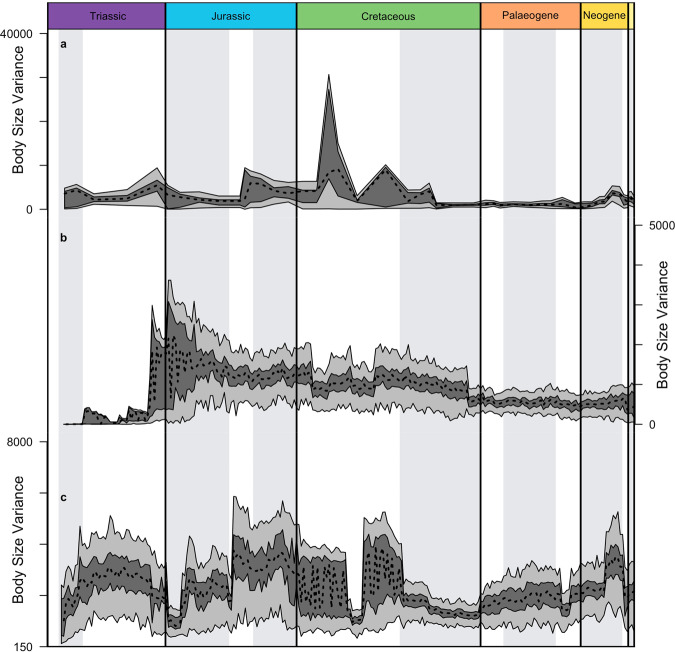
Fig. 3. Time-series representations of relative body size variance.
Three approaches are shown, as in Fig. 4: (a) actual taxa binned at the resolution of stratigraphic stages; (b) actual taxa plus ghost ranges inferred using branch lengths; (c) actual taxa plus ghost ranges plus phylogenetically reconstructed body size values of inferred common ancestors. The taxa sampled across all methods were subjected to bootstrapping; the interquartile range is shown in dark grey, the total range in light grey.

