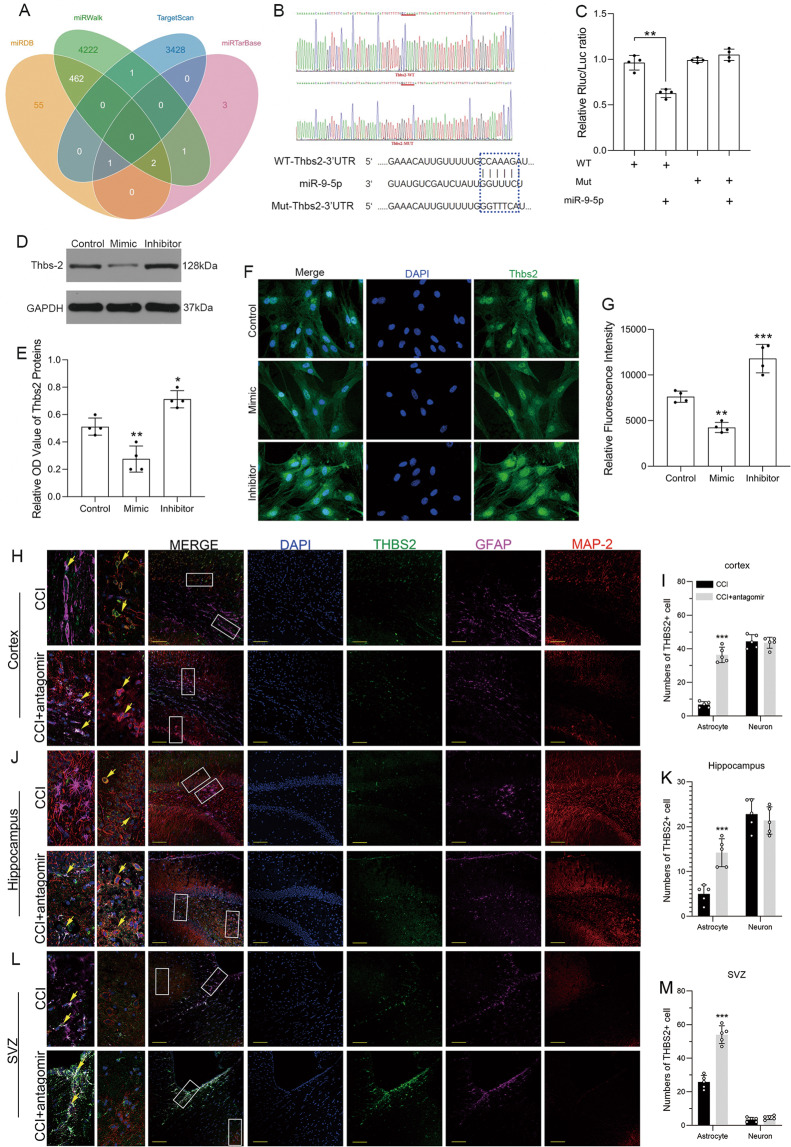
Fig. 3. miRNA-9-5p targeted the 3′UTR of Thbs-2 mRNA, and downregulation of miRNA-9-5p promoted the expression of Thbs-2 in astrocytes.
A Prediction of the miRNA-9-5p target and B construction of the Thbs-2 mutation site. C The dual luciferase reporter assay (*P < 0.05, **P < 0.01 versus the WT group). D The immunoblotting and E quantitative data of Thbs-2 in astrocytes. F The immunofluorescence (bar = 100 μm) and G quantitative data of Thbs-2 in astrocytes (n = 4/group) (*P < 0.05, **P < 0.01, ***P < 0.001 versus the control group). H The immunofluorescence (bar = 100 μm) and I quantitative data of Thbs-2 in the cortex. J The immunofluorescence (bar = 100 μm) and K quantitative data of Thbs-2 in the hippocampus. L The immunofluorescence (bar = 100 μm) and M quantitative data of Thbs-2 in the SVZ (n = 5/group) (*P < 0.05, **P < 0.01, ***P < 0.001 versus the CCI group) (WT: wild type, Mut: mutant type, CCI: control cortex impact, SVZ: subventricular zone). Error bars indicate mean ± SD.

