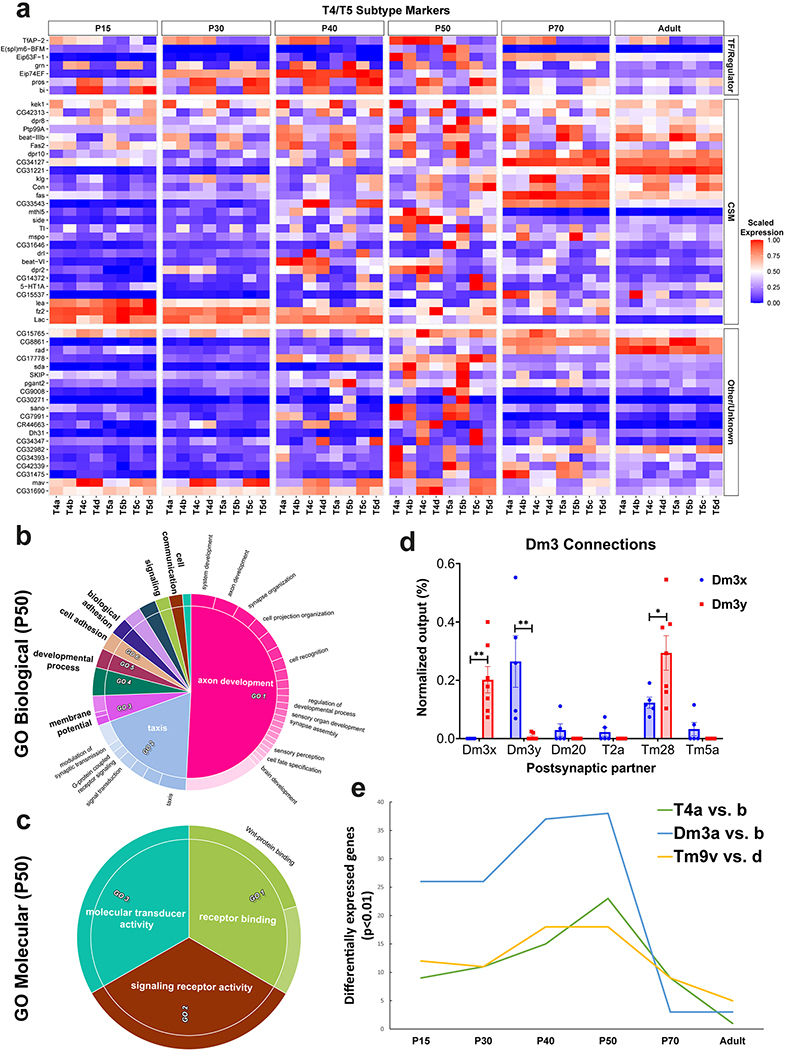
Extended Data Figure 10: Increased transcriptomic diversity during synaptogenesis.
a, Log-normalized and scaled (to the max of 1 for each gene across all time points) expression of top10 (by logFC, calculated at P50) subcluster markers between T4 and T5 subtypes at all stages. TF: Transcription Factor, CSM: Cell Surface Molecule. b-c, GO enrichment analysis of all (269) differentially expressed genes between the T4-T5 subclusters at P50. All Biological Process (b) and Molecular Function (c) terms with greater than 2-fold enrichment were summarized by REVIGO to eliminate redundant terms and group related ones together. Inner rings in the CirGO plots indicate the summarized terms (names in bold). Some individual terms (outer ring) relevant to neuronal function and development are also labeled. Areas within the graphs are determined by the p-values of the terms. d, Average normalized number of presynaptic sites from Dm3 neurons with orthogonally oriented dendritic arbors (Since we could not assign the anatomical directions from the EM data, we plotted them as Dm3x and Dm3y) to indicated neuronal types (Methods). Only the outputs showing differences between the subtypes are plotted. Error bars denote SEM. p-value: 0.004 (Dm3x), 0.006 (Dm3y), 0.04 (Tm28), unpaired parametric two-tailed t-tests (n = 5 and 7 Dm3 cells per type). e, Number of genes differentially expressed between the indicated subtypes with a p-value < 0.01 (two-sided Wilcoxon Rank Sum), calculated after down-sampling the number of cells in each group to 150 for consistency.

