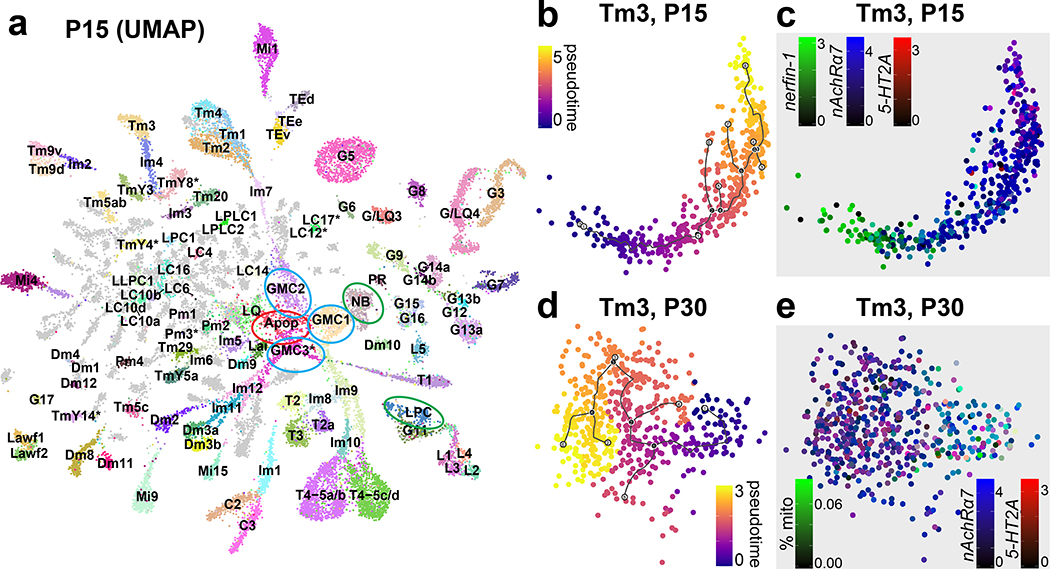
Figure 3: Transcriptomic synchronization of optic lobe neurons.
a, UMAP visualization of the P15 dataset (parameters as in Fig.1d). Ellipses: undifferentiated neurons undergoing apoptosis (red), stem cells (green), intermediate precursors (blue). b-e, UMAP visualization of the Tm3 cluster at P15 and P30. Cells are colored by their position on the pseudotime trajectory inferred by Monocle 3 (Methods) and shown here as black lines (b, d); or by their log-normalized non-integrated expression level of nerfin-1 (c), nAChRα7, 5-HT2A (c, e), and by the ratio of total mitochondrial transcripts they have (e). Scale bars = 30 μm.

