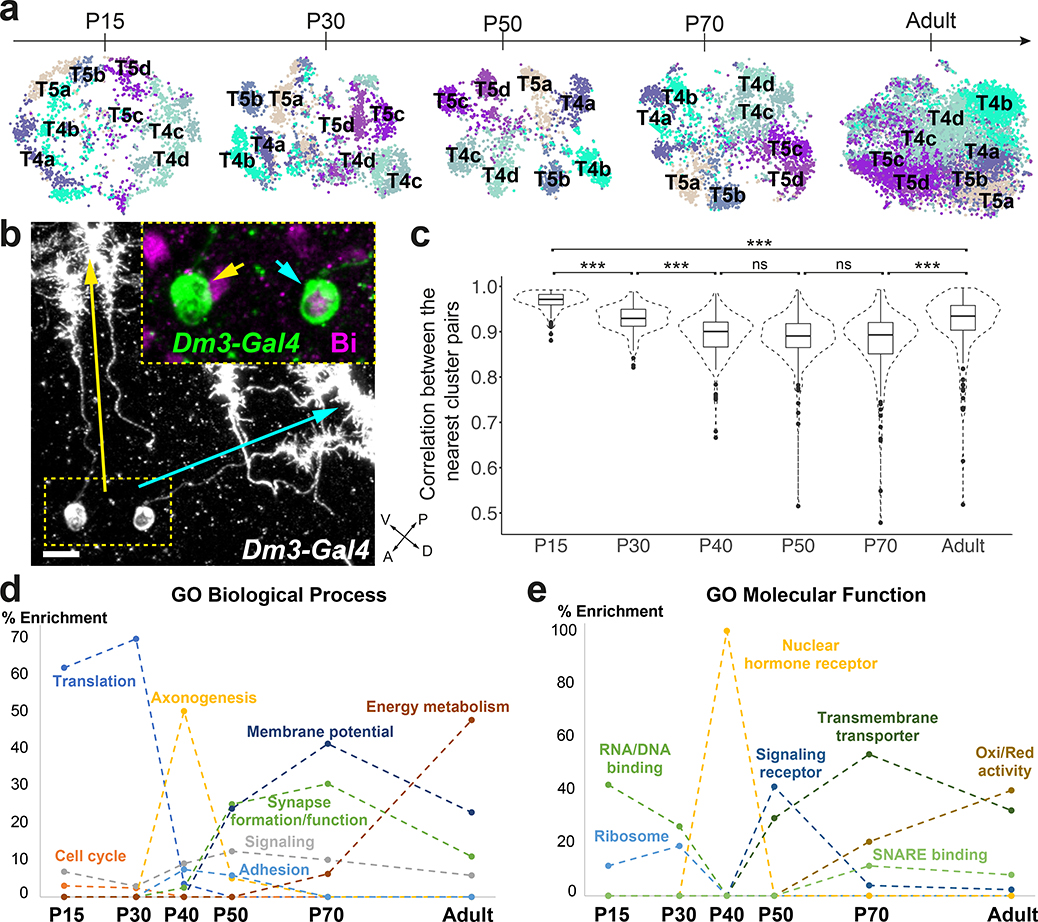
Figure 4: Increased transcriptomic diversity during synaptogenesis.
a, tSNE visualizations of T4 and T5 neurons, using 20 principal components calculated on the log-normalized integrated gene expression, across development. b, R25F07(Dm3)-Gal4 sparse expression at P50 with anti-Bi (Omb) staining (n=10 brains). Yellow and cyan arrows/arrowheads indicate dendrites/cells bodies of a posterior-ventrally and a posterior-dorsally oriented Dm3, respectively. Scale bar = 5 μm. c, Plot of the highest Pearson correlation between each neuronal cluster (n=175) and all other neuronal clusters, at each stage, using all genes belonging to the top10 cluster markers of at least one stage. ***: adjusted p-value<0.001 (P15–30: 7X10⁻¹¹, P30–40: 4X10⁻¹⁰, P70-Adult: 1X10⁻¹¹, P15-Adult: 3X10⁻¹³), n.s: non-significant, one-way ANOVA with Tukey Honest Significant Differences. Boxplots display the first, second and third quartiles. Whiskers extend from the box to the highest or lowest values in the 1.5 inter-quartile range, and outlying datapoints are represented by a dot. d-e, Summary of GO enrichment analysis performed on the stage markers (Extended Data Fig.11a).

