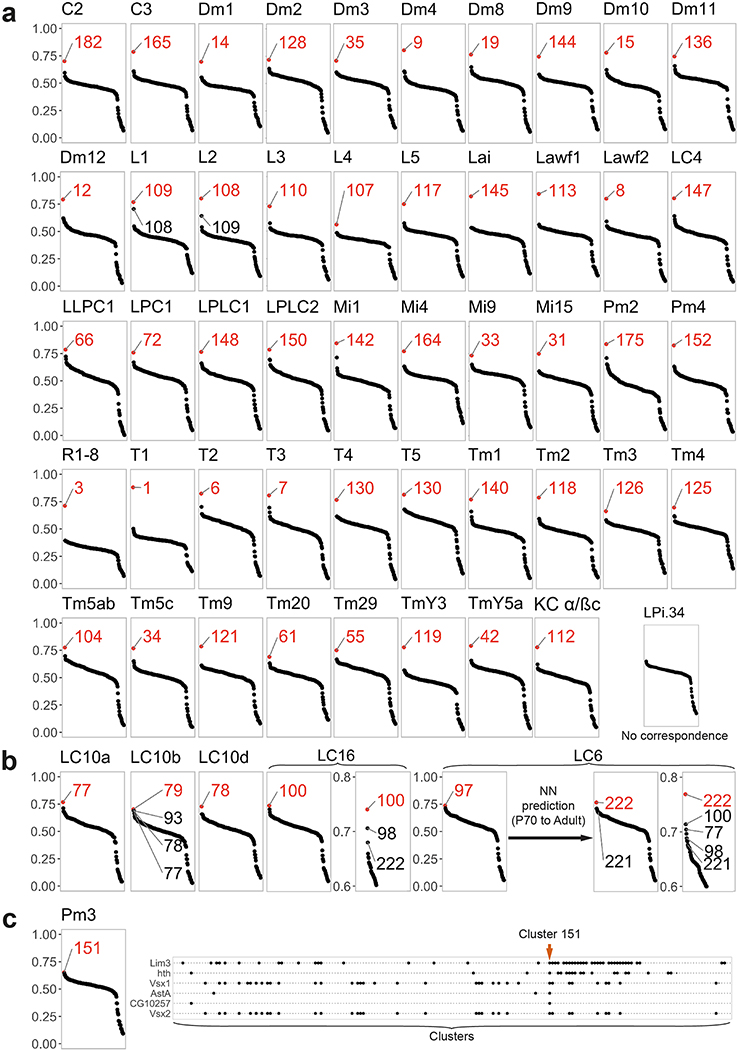
Extended Data Figure 3: Identification of the adult neuronal clusters.
a, Pearson correlation between the average log-normalized non-integrated expression of the top10 cluster markers of the adult dataset clusters (x-axis) and the transcriptome of isolated neurons18,20. We represented Dm3, Tm9, T4 and T5 before their split into Dm3a/b, Tm9v/d, T4/T5ab and T4/T5cd. When two transcriptomes were published for a given neuronal type, the one presenting the highest correlation gap is displayed in this figure. R1–8: average gene expression of all photoreceptors20. KC: Kenyon Cells, cluster 112 therefore likely corresponds to contamination from the central brain. b, Legend as in (a). We indicated several matching clusters to highlight the high similarity between LC cells transcriptomes, which explains the lower correlation gaps observed for these neurons. c, Left: Legend as in (a). Right: mixture modelling of Pm3 markers19 (y axis). Clusters are spread on the x-axis, with the probability of expression of the markers figured by the size of the black dots.

