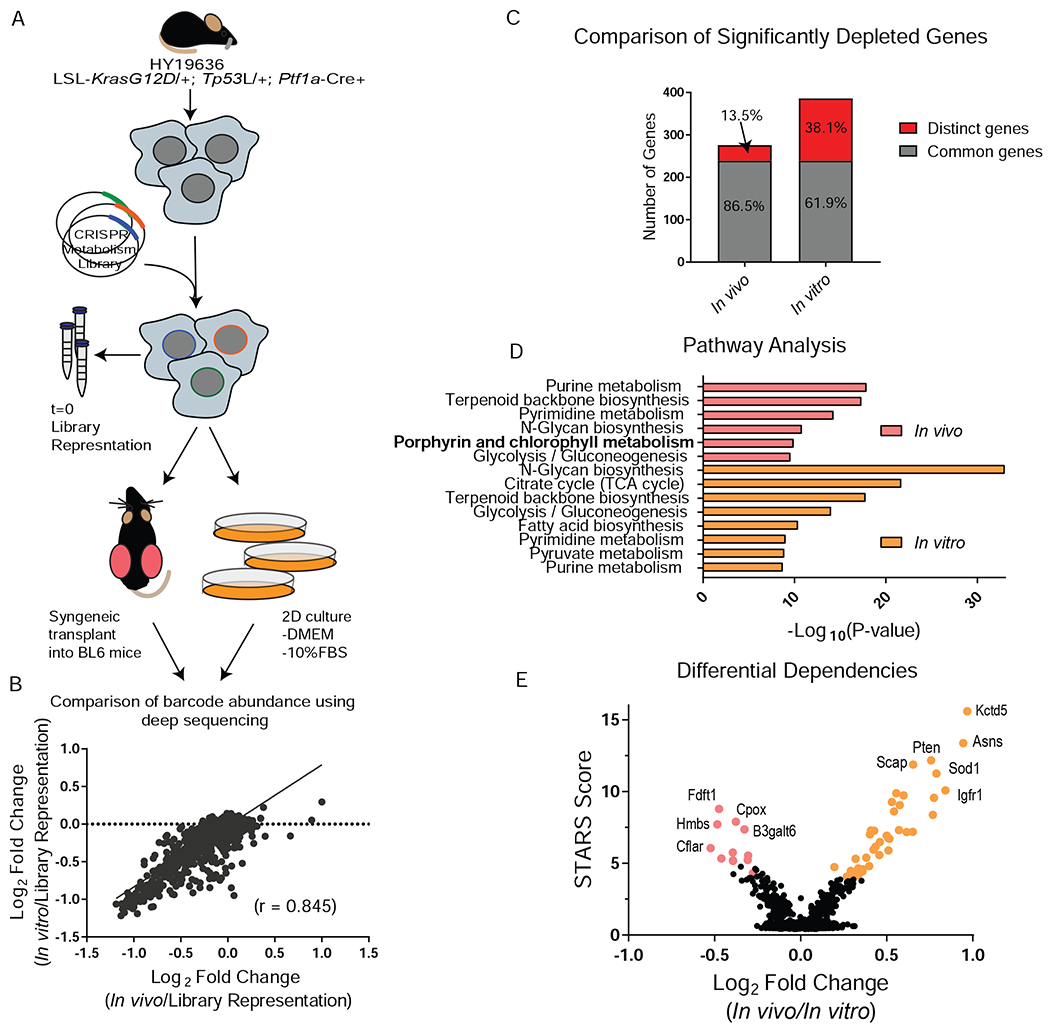
Figure 1. Parallel CRISPR-Cas9 metabolism screens reveal metabolic dependencies in PDA.

A, Schematic of parallel CRISPR/Cas9 screen design using a B6 KPC line. B, Gene score correlation between in vitro (passage 7, P7) and in vivo. C, Comparison of significantly depleted genes (FDR < 0.2) in the in vitro (P7) and in vivo screen. FDR is calculated using STARS algorithm. D, Pathway analysis of significantly depleted genes (FDR < 0.2) using Metaboanalyst. The –Log10 p-value of the most enriched pathways (FDR < 0.005) are represented. E, Differential dependencies are plotted by looking at the delta log fold change between in vivo and in vitro (P7) conditions. STARS score is plotted on the y axis and differentially required genes with an FDR < 0.02 are colored.
