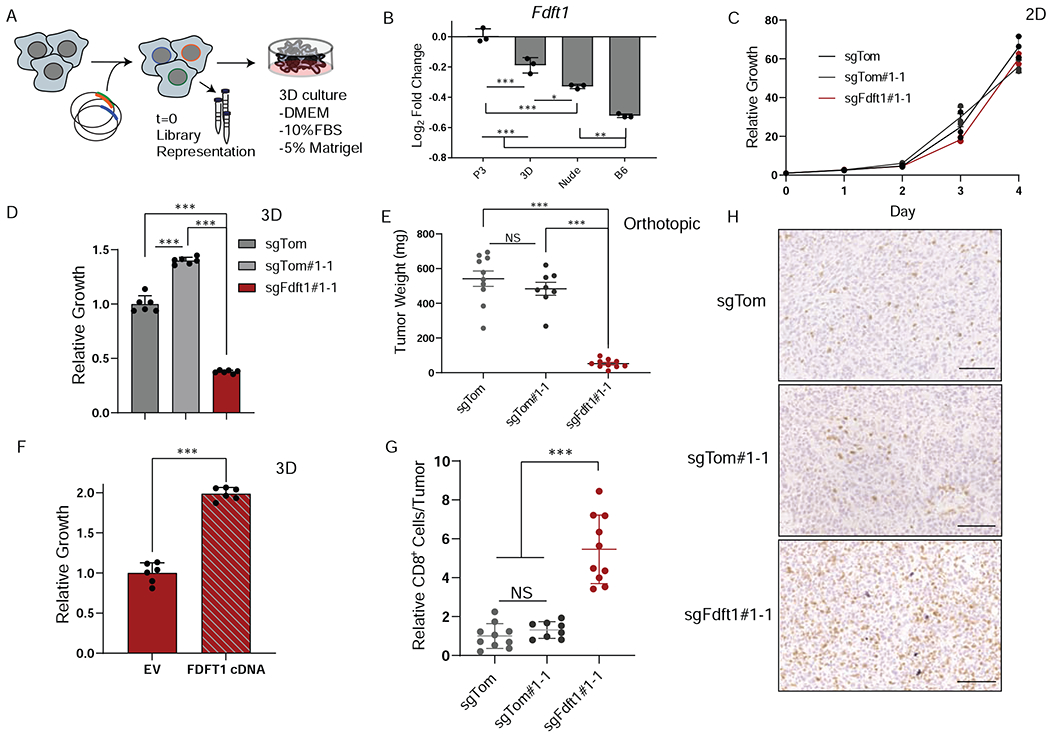
Figure 4. Three-dimensional culture reveals differential dependency on Fdft1.

A, Schematic depicting experimental design for 3D metabolism screen. B, Log fold change of Fdft1 is plotted for P3, 3D, Nude, and B6 experimental conditions. Error bars depict ± s.d. of experimental condition (screens performed in triplicate). C, Relative proliferation rates of sgTom (polyclonal), sgTom#1-1 (clone), and sgFdft1#1-1 (clone) cells grown in 2D culture. Data are plotted as relative cell proliferation normalized to day 0 in arbitrary units. Error bars depict ± s.d. of three independent wells from a representative experiment.. D, Relative growth of sgTom (polyclonal), sgTom#1-1 (clone), and sgFdft1#1-1 (clone) cells grown in 3D culture and assessed by cell titer-glo (CTG). Data are plotted as relative luminescent signal to sgTom. Error bars depict ± s.d. of 6 independent wells from a representative experiment. E, Tumor weight after orthotopic implantation of sgTom (polyclonal) (n = 10), sgTom#1-1 (clone) (n = 8), and sgFdft1#1-1 (clone) (n = 10) cells into the pancreata of B6 mice harvested at endpoint. Error bars depict ± s.e.m of individual tumor weights. F, Relative growth of sgFdft1#1-1+ empty vector (EV) and sgFdft1#1-1 + human FDFT1 cDNA (FDFT1 cDNA) cells grown in 3D and assessed by cell titer-glo (CTG). Data are plotted as relative luminescent signal to sgFdft1#1-1 + EV. Error bars depict ± s.d. of 5 independent wells from a representative experiment G, Quantification of CD8a positive cells in either sgTom (polyclonal), sgTom#1-1 (clone), and sgFdft1#1-1 (clone) orthotopic tumors injected into the pancreata of B6 mice. Error bars depict ± s.d. of 10 independent tumors (sgTom), 8 independent tumors (sgTom#1-1) and 10 independent tumors (sgFdft1#1-1). F, Representative images of IHC for CD8a cells performed on sgTom (polyclonal), (n = 10), sgTom#1-1 (clone) (n = 8), and sgFdft1#1-1 (clone) (n = 10) orthotopic tumors. Scale bar represents 100μm. For all panels, significance determined with an unpaired 2 tailed t-test. *P<0.05, **P<0.01, ***P<0.001, ns: non-significant, P>0.05.
