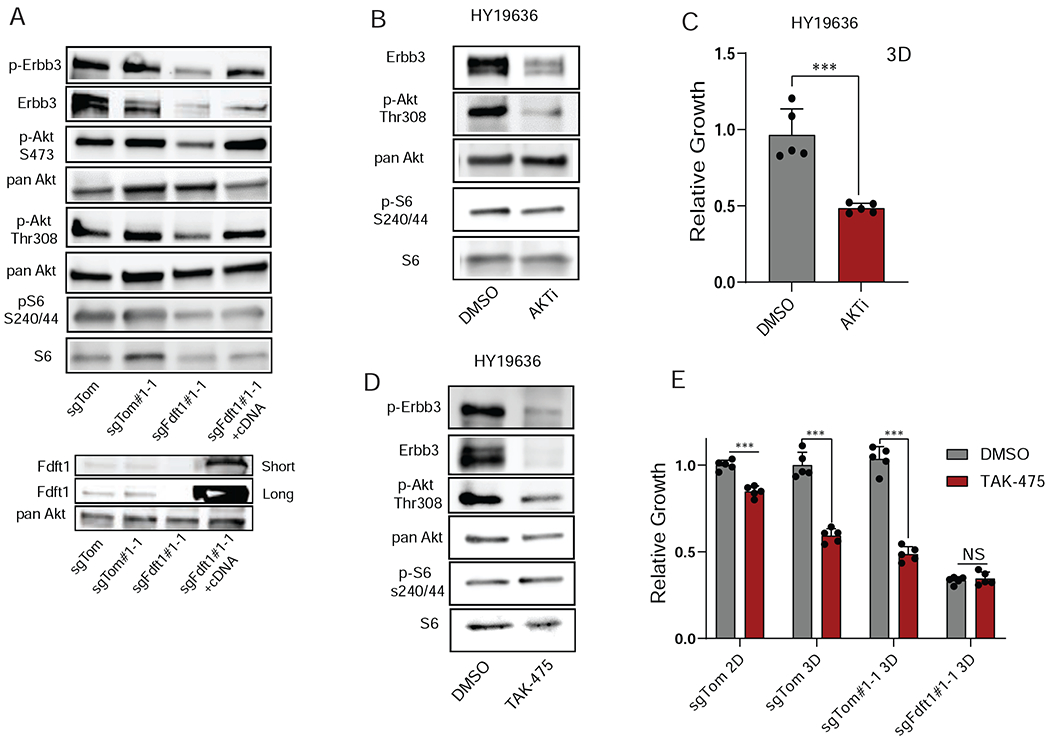
Figure 5. Fdft1 potentiates Akt signaling in PDA cells.

A, Western blot of sgTom (polyclonal), sgTom#1-1 (clone), sgFdft1#1-1 (clone), sgFdft1#1-1 + FDFT1 cDNA (rescue clone) cell lysates for p-Erbb3, Erbb3, p-Akt S473, pan Akt, p-Akt Thr 308, pS6 S240/44, S6, and Fdft1 in 3D conditions. B, Western blot of HY19636 cells treated with either DMSO or 1μM AKTi (MK-2206) in 3D conditions. Cell lysates were probed for Erbb3, p-Akt Thr308, pan Akt, p-S6 S240/44, and S6. C, Relative growth of HY19636 cells treated with either DmSo or 1μM AKTi (MK-2206). Growth was assessed by cell titer-glo (CTG). Data are plotted as relative luminescent signal to DMSO. Error bars depict ± s.d. of 5 independent wells from a representative experiment. D, Western blotting of HY19636 cells treated with either DMSO or 5μM TAK-475 in 3D conditions. Cell lysates were probed for p-Erbb3, Erbb3, p-Akt Thr 308, pan Akt, p-S6 S240/44, and S6. E, Relative growth of sgTom (polyclonal), sgTom#1-1 (clone), sgFdft1#1-1 (clone) cells treated with either DMSO or TAK-475 in 2D (sgTom) and 3D (sgTom, sgTom#1-1, sgFdft1#1-1) culture. Data are plotted as relative absorbance or luminescent signal to sgTom for 2D and 3D conditions respectively. Error bars depict ± s.d.of 3 (2D) or 5 (3D) independent wells from a representative experiment. For all panels, significance determined with an unpaired 2 tailed t-test. *P<0.05, **P<0.01, ***P<0.001, ns: non-significant, P>0.05.
