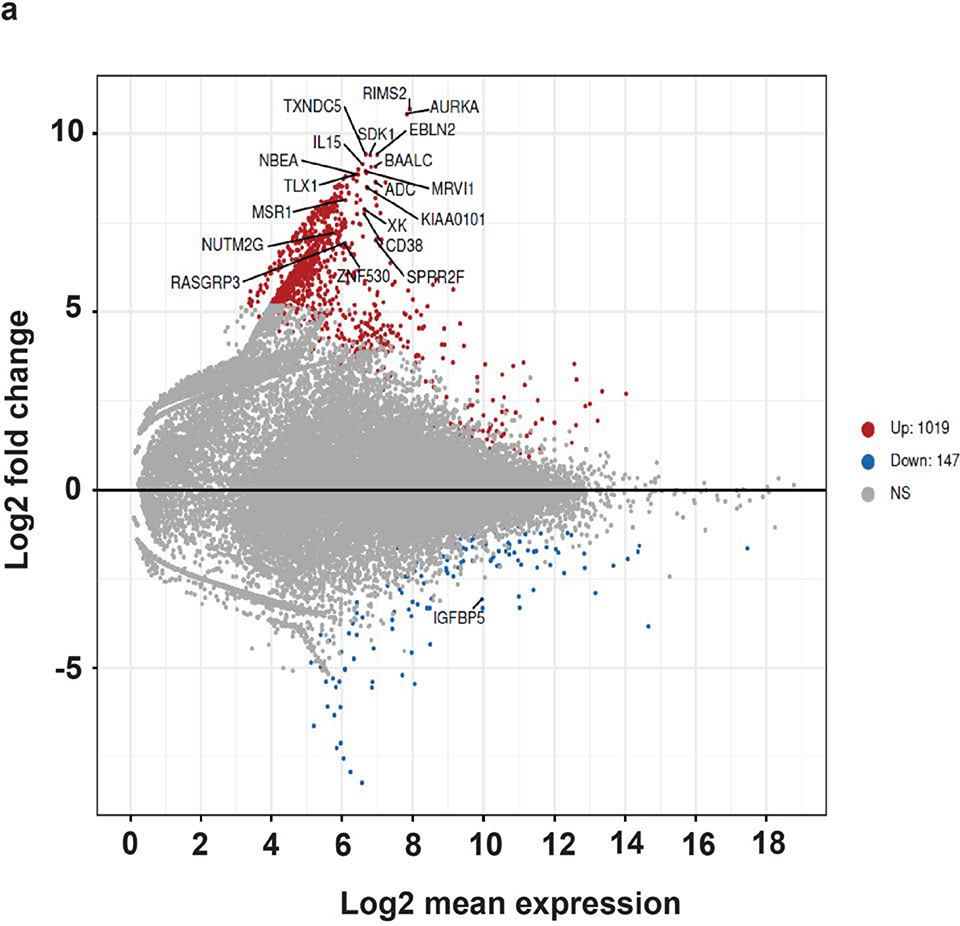
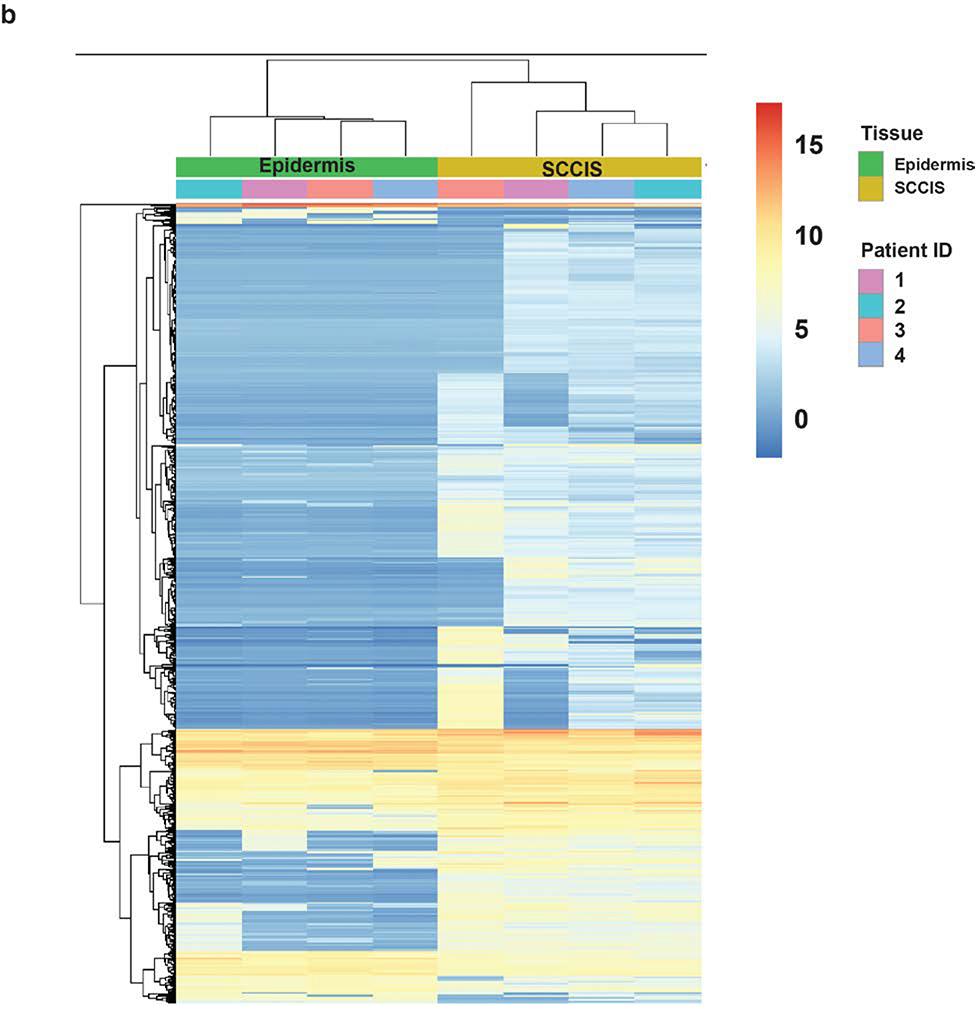
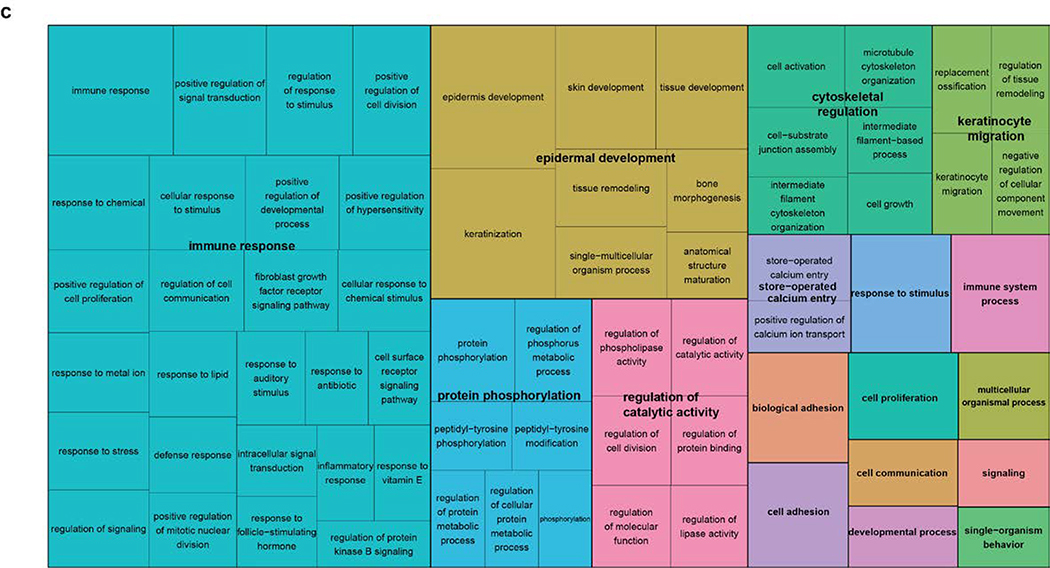
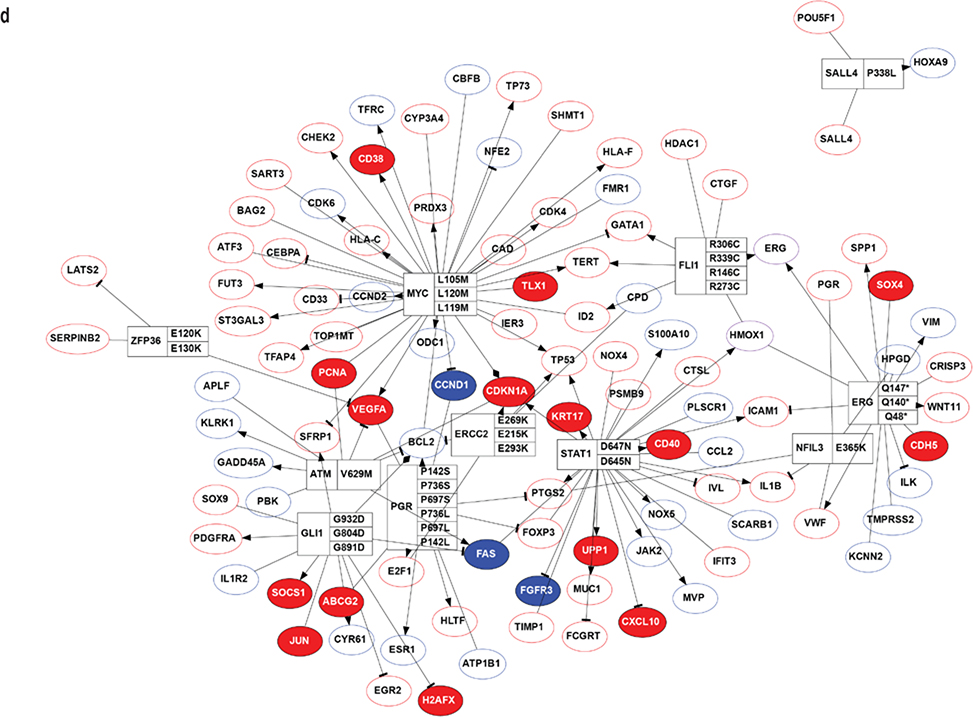
Figure 4. Transcriptomic analysis of the RNA-seq dataset.
(a). MA-plot of all gene expression profiles revealed by RNA-seq data. X,Y-axes: A (average) and M (difference) of the gene expression between epidermis and SCCIS samples; Red and blue dots: up-regulated and down-regulated genes determined by DESeq2. Top 20 differentially expressed (DE) protein coding genes are labeled with their symbols. (b) Heatmap of top 1162 DE-genes, with their tissue type and patient ID information labeled by each column. Cell values are the normalized regularized log expression values calculated by DESeq2. Adj p value < 0.1 (c) Enriched Gene Ontology (GO) Biological Processes associated with DE-genes. Rectangle sizes reflect the significance of enrichment of each terms, with similar GO terms grouped into larger rectangles. (d) Core transcriptional regulator-target (TR-target) network for genes harboring subclonal UVD variants, only top genes with no less than 5 targets are included. Rectangles: transcriptional regulators with their names and associated subclonal UVD variants labeled; ellipses: known target genes from TRRUST database. Red or blue filled/bordered nodes represent genes with increased or decreased average expression in SCCIS compared to epidermis, respectively. Ovals with solid colors represent significantly differentially expressed genes (Adj p value < 0.1), ovals outlined color represent genes that were differentially expressed with an adjusted p value > 0.1. Arrows represent a positive regulatory relationship. T-bars represent a negative regulatory relationship.


