
Figure 1. Study design and model visualization for differential gene expression analysis.
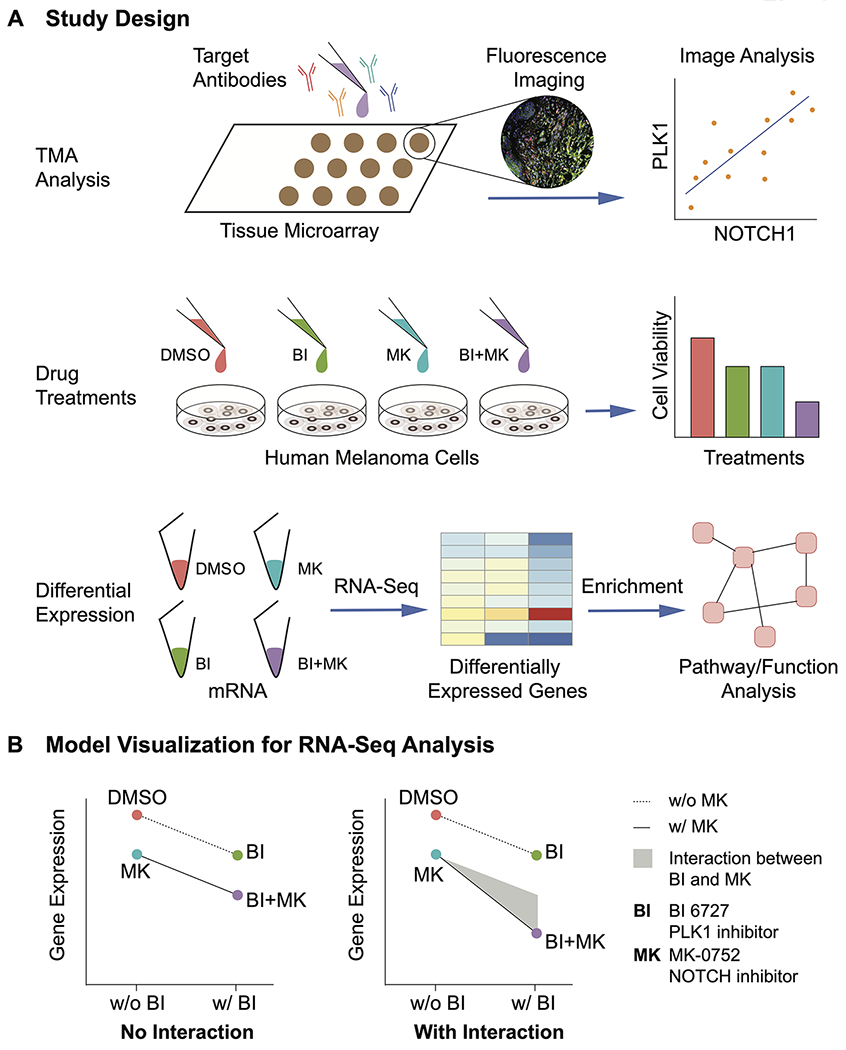
A, Experimental design for our studies. Our in-house tissue microarray (TMA) was stained with target antibodies including PLK1 and NOTCH1 followed by imaging, quantification and analysis. In vitro, human melanoma cells were treated with PLK1 inhibitor BI 6727 (BI) and/or NOTCH inhibitor MK-0752 (MK). The cell viability was assessed to evaluate the synergism between the two inhibitors. Next, we used RNA-seq to examine differential expression between the different treatment groups, followed by pathway and function analysis of these genes. B, Model visualization for drug interactions. A negative binomial model with an interaction term was implemented to compare the gene expression across all treatments. In the scenario without the interaction between BI and MK, the drug effects for the BI+MK combined treatment result solely from the addition of single drug effects. In the second scenario with drug interaction, the drug effects for the BI+MK combination came from i) the addition of single drug effects, and ii) the interaction or synergism between BI and MK shown as grey area, aka BI:MK.