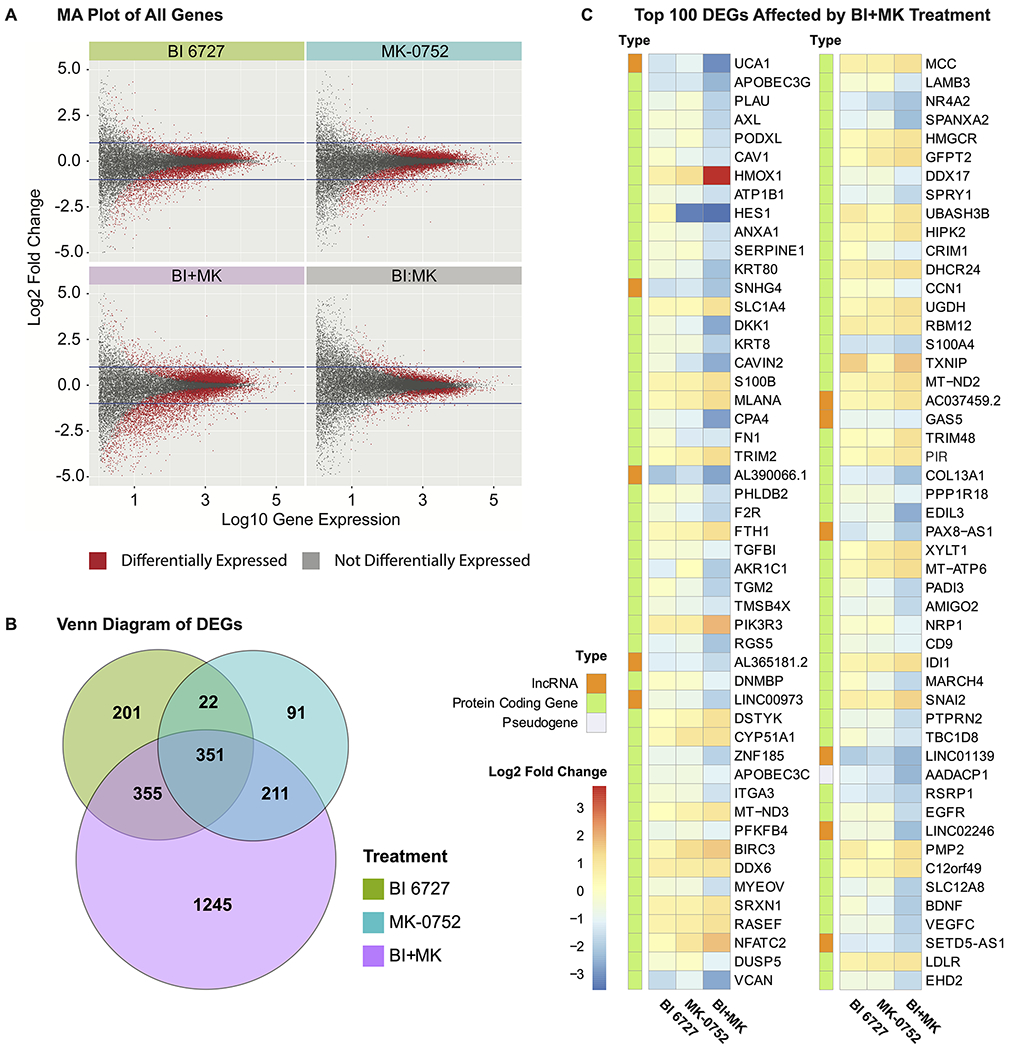
Figure 4. PLK1 and/or NOTCH inhibition in SK-MEL-2 melanoma cells via small molecule inhibitors leads to differential expression of genes as measured using RNA-seq analysis.

A, MA (log ratio - mean average) plot of all genes. Plots of gene expression against fold change for all genes affected by BI 6727, MK-0752, the combination of the two drugs (BI+MK), as well as the interaction of the two drugs (BI:MK). The differentially expressed genes (DEGs) are depicted as red dots, while the non-DEGs are depicted as gray dots. In each plot, two horizontal lines are drawn to represent |log2 fold change| =1. B, Venn diagram summarizing the relationships between the DEGs for each treatment. The diagram depicts the DEGs with |log2 fold change| ≥1 in each treatment group and their overlap. C, Heatmap of top 100 most significant DEGs with |log2 fold change| ≥1 in the treatment of BI+MK. The fold change for BI 6727 and MK-0752 single drug treatment, as well as the type of each gene, are also displayed.
