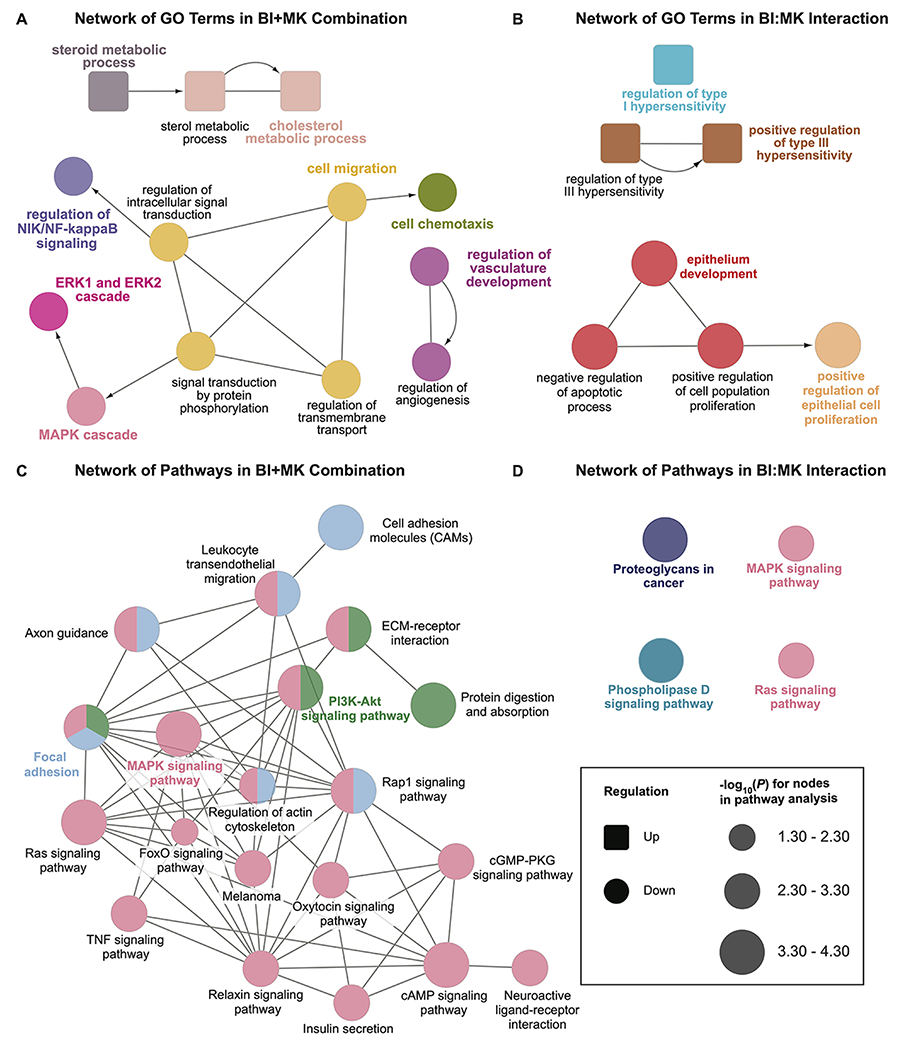
Figure 6. Inhibition of PLK1 and NOTCH in SK-MEL-2 melanoma cells results in modulation of several GO and KEGG pathway networks.

Nodes with same color belong to the same cluster of GO terms or pathways. Nodes connected by undirected edge indicate the two nodes are relevant to each other. Nodes connected by arrows indicates a hierarchical relationship in Gene Ontology. A, Network of GO terms affected by the combination of BI 6727 and MK-0752. B, Network of GO terms affected by the interaction of BI 6727 and MK-0752. C, Network of KEGG pathways affected by combination of BI 6727 and MK-0752. D, Network of KEGG pathways affected by interaction of BI 6727 and MK-0752.
