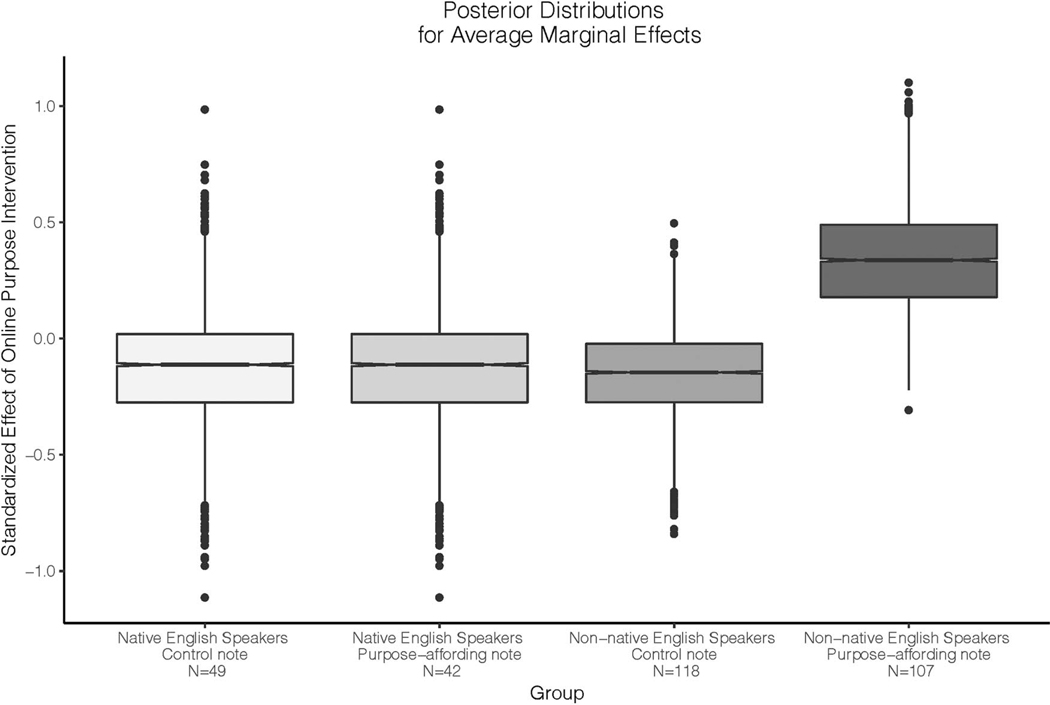
Figure 3.
Treatment effects of the student purpose lay theory intervention on writing assignment scores (vs. the control condition) by note condition and nonnative English speaker status, estimated in a Bayesian Causal Forest analysis. The figure plots values drawn from the posterior distribution of individual treatment effects—one draw per participant. Posterior distributions are updated from a prior distribution centered at an effect size of 0 (the middle of the y-axis); therefore, the distances of the distributions from 0 represent the extent to which the data updated that prior belief of no effect (and no difference in effects across groups). Boxes represent the interquartile range, lines represent the middle 95% of the distribution, and individual data points are draws from the posterior that extend beyond the middle 95% of the distribution. The outcome ranged from 0 to 3 with a standard deviation of about 1, so the unstandardized effects on the y-axis are approximately the same as the corresponding standardized mean differences.

