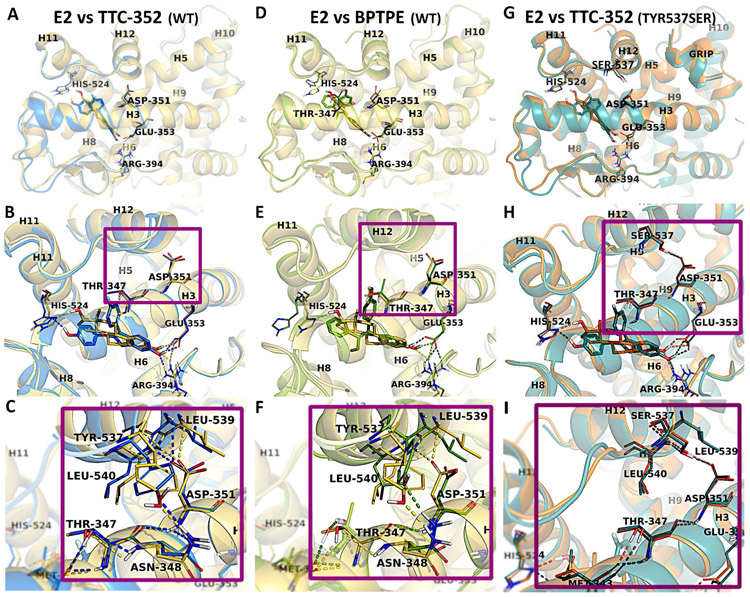
Figure 5. Representation of ERα-LBD with E2, TTC-352, and BPTPE.
Comparison of the WT structures of E2 (yellow), TTC-352 (blue), and BPTPE (green) bound to hERα. The superposition of the X-ray structures of hERαLBD:E2 with hERαLBD:TTC-352 (A), and of hERαLBD:E2 with hERαLBD:BPTPE (D). The closer views of the active sites show the binding modes of E2 (yellow), in comparison with TTC-352 (blue) (B) and BPTPE (green) (E), together with the H-bond contacts between H3 and H12 for E2, TTC-352 (C) and BPTPE (F). The superposition of the mutant Tyr537Ser X-ray structures of hERαLBD in complex with E2 (orange) and TTC-352 (teal) (G), together with the binding site alignment of the ligands (H), and a close view of the H-bond interactions between Asp351 and Ser537 (I). Amino acid residues involved in direct interactions (i.e., H-bonds and hydrophobic contacts) are labeled and shown in sticks, together with the amino acids directly involved in H-bonds with H12. In the overall structures, H12 is labeled together with the helices that form the ligand binding site (i.e., H3, H6, H8, H11,) and part of the coactivator site (i.e., H5, H9, H10). The H-bonds are displayed (dashed lines) in yellow, blue, and green in the structures of E2, TTC-352, and BPTPE, respectively.

