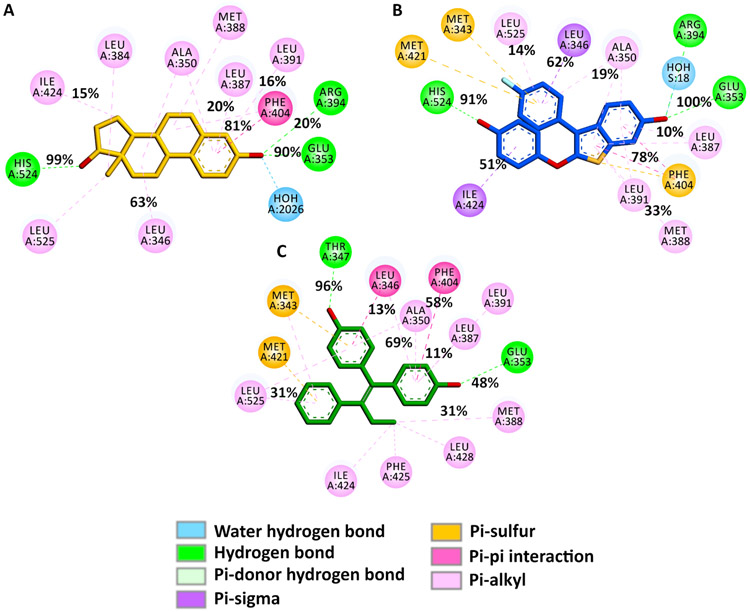
Figure 6. 2D ligand-ERα interaction maps highlighting key interactions between the ligands and ERα’s amino acids during the simulations.
These maps were generated from the recorded trajectories and the occurrences of the key contributing interactions between E2 (A), TTC-352 (B), BPTPE (C), and the amino acids in the binding site of ERα, as shown.

