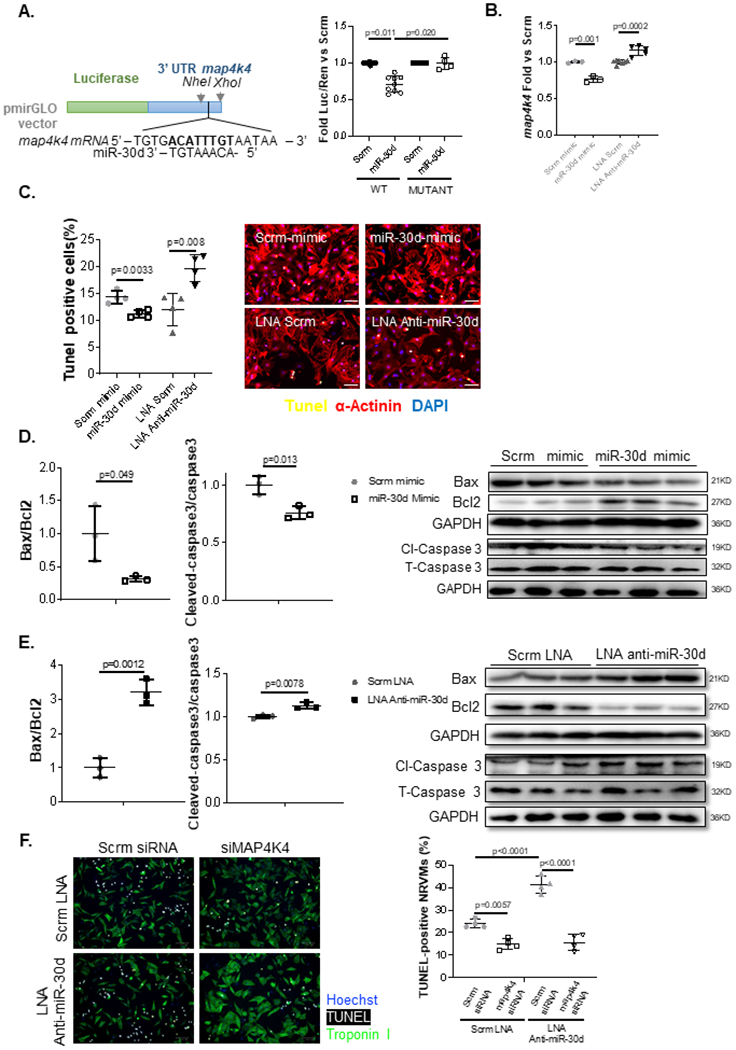
Figure 3. Map4k4 is a direct target of miR-30d and mediator of its protective effects on cardiomyocytes.

A. 500bp of map4k4’s 3’UTR fragments containing WT or mutated seed sequences were cloned into pmirGLO vectors, and transfected into HEK293 cells in the presence of miR-30d mimic or scramble. Luciferase expression quantification are shown for map4k4. WT Scrm n=9, WT miR-30d n= 9, Mutant Scrm n=4, Mutant miR-30d n=4. P values calculated with non-parametric ANOVA test, corrected using Dunn’s multiple comparison test. B. NRVMs were transfected with either miR-30d mimic or LNA anti-miR-30d and map4k4 mRNA expression was determined 48h later through qPCR; data is represented as fold change vs respective scramble condition. Scrm mimic n=3, miR-30d mimic n=3, LNA Scrm n=7, LNA Anti-miR-30d n=5. C. Role of miR-30d in apoptotic pathways in NRVMs was first determined by transfecting miR-30d mimic or LNA anti-miR30d into NRVMs cultured under anaerobic and serum/glucose free conditions, and co-staining them for TUNEL and α-actinin; results are graphed on the left and representative pictures are shown on the right. Scale bar= 50μm. Scrm mimic n=4, miR-30d mimic n=4, LNA Scrm n=4, LNA Anti-miR-30d n=4. D-E. Role of miR-30d in the Bax/Bcl2 and Caspase-3 apoptotic pathways were determined by transfecting NRVMs with miR-30d mimic (D) or LNA anti-miR-30d (E), and determining the protein levels of these molecules by western blot; quantifications are shown on the left, and representative blots on the right. Scrm mimic n=3, miR-30d mimic n=3, LNA Scrm n=3, LNA Anti-miR-30d n=3. Normality of data (D-G) determined with Shapiro-Wilks test. P values (D-G) calculated with unpaired parametric t-test. F. Quantification of apoptotic NRVMs in response to co-transfection of siRNA anti-map4k4 and LNA Anti-miR-30d under nutrient deprivation and hypoxia. NRVMs transfected with siRNA anti-map4k4 and/or LNA Anti-miR-30d, or their respective negative controls, cultured under glucose and serum deprivation were exposed to hypoxia for 8h, followed by 12h of normoxia in complete media. TUNEL+ Troponin+ NRVMs were quantified through immunofluorescence. Representative images are shown on the left and quantification on the right. Scrm LNA + Scrm siRNA n=4, Scrm LNA + map4k4 siRNA n=4, LNA Anti-miR-30d + Scrm siRNA n=4, LNA Anti-miR-30d + map4k4 siRNA n=4. P values calculated with ordinary ANOVA test, corrected using Tukey’s multiple comparison test. Data are represented as mean ± SD.
