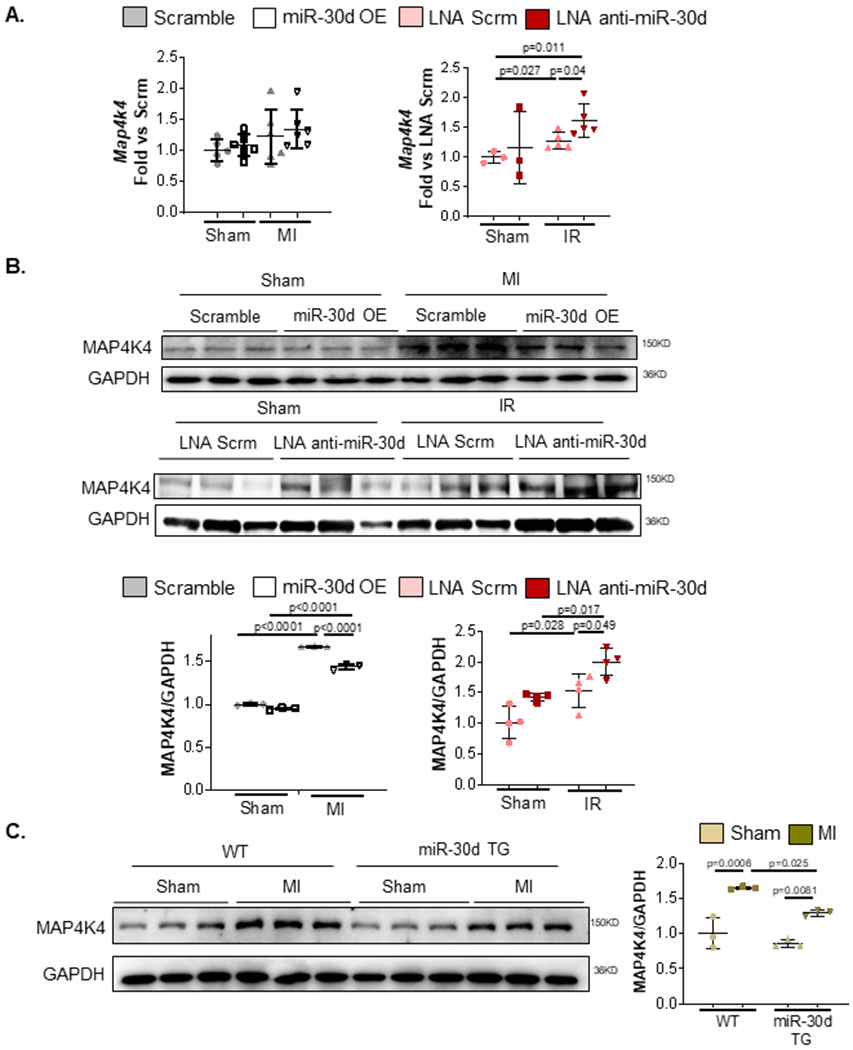
Figure 4. miR-30d regulates map4k4 expression levels in vivo.

Map4k4 expression levels were determined in miR-30d overexpression and loss of function conditions in C57BL/6 mice undergoing Sham, MI or IR surgery. A. mRNA levels of map4k4 were quantified through qPCR in the heart tissue of mice with lentivirus induced miR-30d OE or LNA mediated miR-30d loss of function. Data is represented as fold versus scramble lentivirus or LNA scramble conditions, respectively. Sham Scrm Lentivirus n=5, Sham miR-30d OE Lentivirus n=6, MI Scrm Lentivirus n=6, MI miR-30d OE Lentivirus n=6 .Sham LNA Scrm n=3, Sham LNA Anti-miR-30d n=3, IR LNA Scrm n=5, IR LNA Anti-miR-30d n=5. Normality of data determined with Shapiro-Wilks test. P values calculated with unpaired parametric t-test. B. Protein levels of MAP4K4 were quantified via western blot in the cardiac tissue of either lentivirus induced miR-30d overexpression, or LNA anti-miR-30d mediated loss of function. Representative blots are shown on the top; quantification as fold versus the respective control condition is graphed on the bottom. Sham Scrm Lentivirus n=3, Sham miR-30d OE Lentivirus n=3, MI Scrm Lentivirus n=3, MI miR-30d OE Lentivirus n=3. Sham LNA Scrm n=4, Sham LNA Anti-miR-30d n=4, IR LNA Scrm n=4, IR LNA Anti-miR-30d n=4. C. Protein levels of MAP4K4 were quantified via western blot in the cardiac tissue of either WT or miR-30d overexpression transgenic rats. Representative blots are shown on the left; quantification as fold versus WT Sham is graphed on the right. WT Sham n=3, WT MI n=3, miR-30d TG Sham n=3, miR-30d TG MI n=3. Normality of data (B-C) determined with Shapiro-Wilks test. P values (B-C) calculated with ordinary ANOVA test, corrected using Tukey’s multiple comparison test. Data are represented as mean ± SD.
