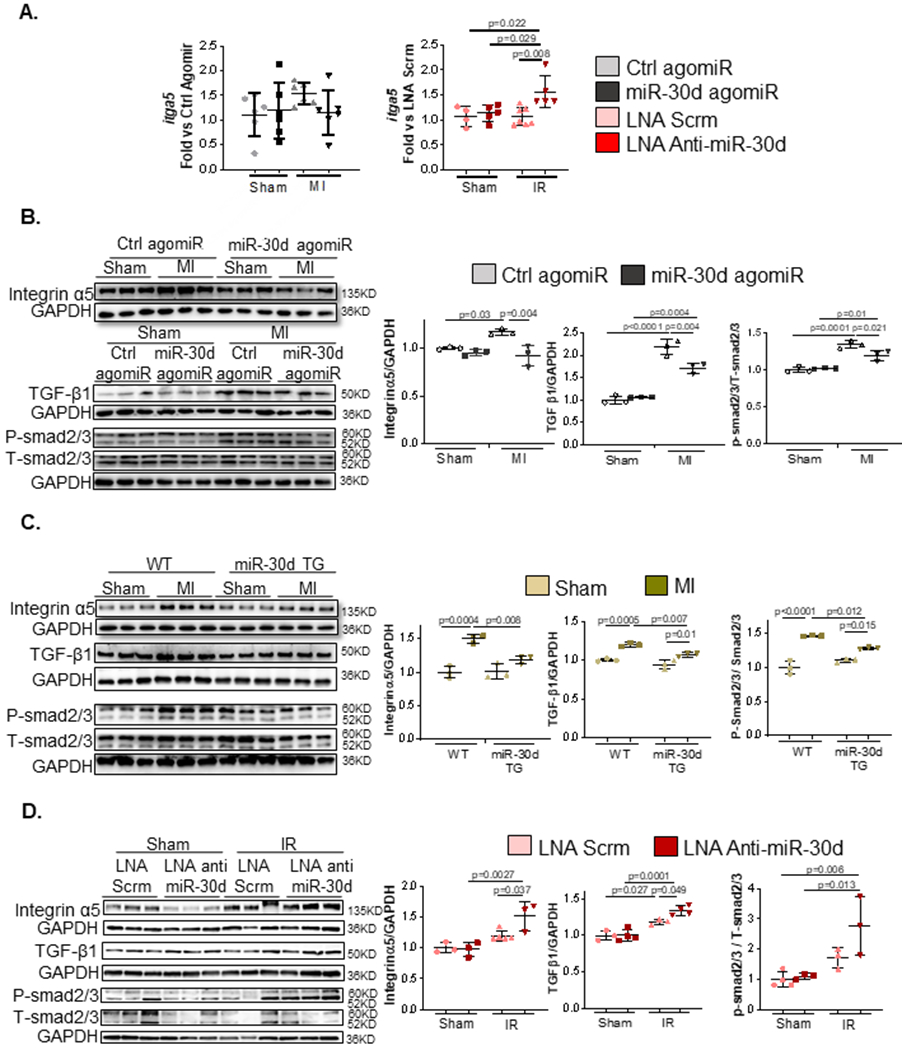
Figure 6. miR-30d regulates key pro-fibrotic pathways in the myocardium in response to ischemic heart failure.

A. mRNA levels of itga5 were quantified through qPCR in the heart tissue of mice with miR-30d agomiR (Sham Ctrl agomiR n=6, Sham miR-30d agomiR n=6, MI Ctrl agomiR n=6, MI miR-30d agomiR n=6) or treated with LNA anti-miR-30d (Sham LNA Scrm n=4, Sham LNA Anti-miR-30d n= 5, IR LNA Scrm n=7, IR LNA Anti-miR-30d n=5). Data is represented as fold versus scramble lentivirus or LNA scramble conditions, respectively.B-C. Protein levels of integrin α5, as well as key proteins in the TGFβ pro-fibrotic pathways were determined by western blot in (B) agomiR-mediated miR-30d overexpression (Sham Ctrl agomiR n=3, Sham miR-30d agomiR n=3, MI Ctrl agomiR n=3, MI miR-30d agomiR n=3) and (C) transgenic rats overexpressing miR-30d (Sham WT n= 3, MI WT n=3, Sham miR-30d TG n=3, MI miR-30d TG n=3); representative blots are shown on the left and quantification of each marker is represented on the right. D. Protein levels of integrin α5, as well as key proteins in the TGFβ pro-fibrotic pathways were determined by western blot in LNA anti-miR-30d treated mice; representative blots are shown on the left and quantification of each marker is represented on the right. Sham LNA Scrm n=3, Sham LNA Anti-miR-30d n= 3–4, IR LNA Scrm n=3–5, IR LNA Anti-miR-30d n=3–4. Normality of data (A-D) determined with Shapiro-Wilks test. P values (A-D) calculated with ordinary ANOVA test, corrected using Tukey’s multiple comparison test. Data are represented as mean ± SD.
