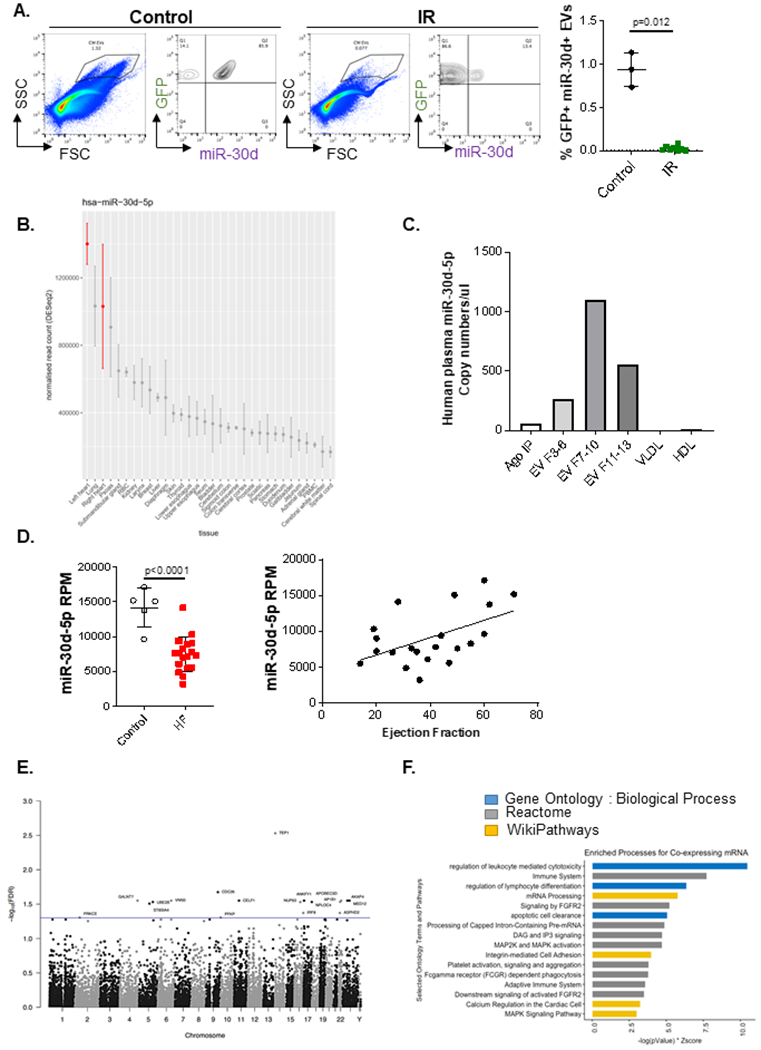
Figure 8. miR-30d in cardiomyocytes and cardiomyocyte-derived-EVs are decreased in chronic ischemic HF, correlating with adverse cardiac remodeling in HF patients (A-C).

A. Presence of miR-30d in CM derived ‘larger-sized’ circulating EVs in plasma (diluted 1/100) of αMHC-MerCreMer - RosamTmG mice subjected to IR is determined through nano flow cytometry, using a specific molecular beacon conjugated to Alexa 647. Representative FACS plots are shown on the left indicating miR-30d expression in GFP+ EVs. Quantification of GFP+ miR-30d+ EVs is represented on the right, Control n=3, IR n= 8. P value calculated with unpaired non-parametric Mann Whitney t-test. Data are represented as mean ± SD. B. Tissue origin of miR-30d based on the Small RNA Atlas analysis. RNA from a variety of tissues were isolated and their small RNA content was sequenced. Normalized read counts are represented from all the tissues investigated. C. miR-30d expression levels associated to different carriers (EV fractions 3-6/ 7-10/ 11-13, Ago-bound RNA and lipoproteins VLDL and HDL) in human pooled plasma quantified by ddPCR. D. On the left, RNA from plasma EVs of patients with HF or controls was sequenced through Illumina HiSeq platform. Reads per million (RPM) are represented for each patient population. N= 5 control, 18 HF. Normality of data determined with Shapiro-Wilks test. P value calculated with unpaired parametric t-test. Data are represented as mean ± SD. On the right, Correlation between miR-30d-5p RPM in plasma EVs of HF patients and controls with their respective ejection fraction (EF) was determined, resulting in r= 0.5085, r2= 0.2586 and two-tailed P value of 0.0186. n=21. Data are represented as mean ± SD. (E-F) In the populational level, co-expression analysis of whole blood mRNA and plasma circulating miRNA in humans suggests a role for miR-30d in integrin and MAPK pathways, among other immune pathways. E. Manhattan plot of all measured genes by chromosome position. Y-axis is −log10(FDR) with a threshold illustrated at FDR < 0.05 (blue line) highlighting 18 genes (labeled). F. Using a relaxed threshold of FDR < 0.10, functional enrichment analysis was performed on 72 genes against Gene Ontology: Biological Process (GO:BP, blue), Reactome (gray) and WikiPathways (gold) using Enrichr. Bar length is a combined score of −log(P-Value) and Z-Score.
