
Fig. 3: Sustained neural activity maintained in AC predicts behavioral auditory WM capacity.
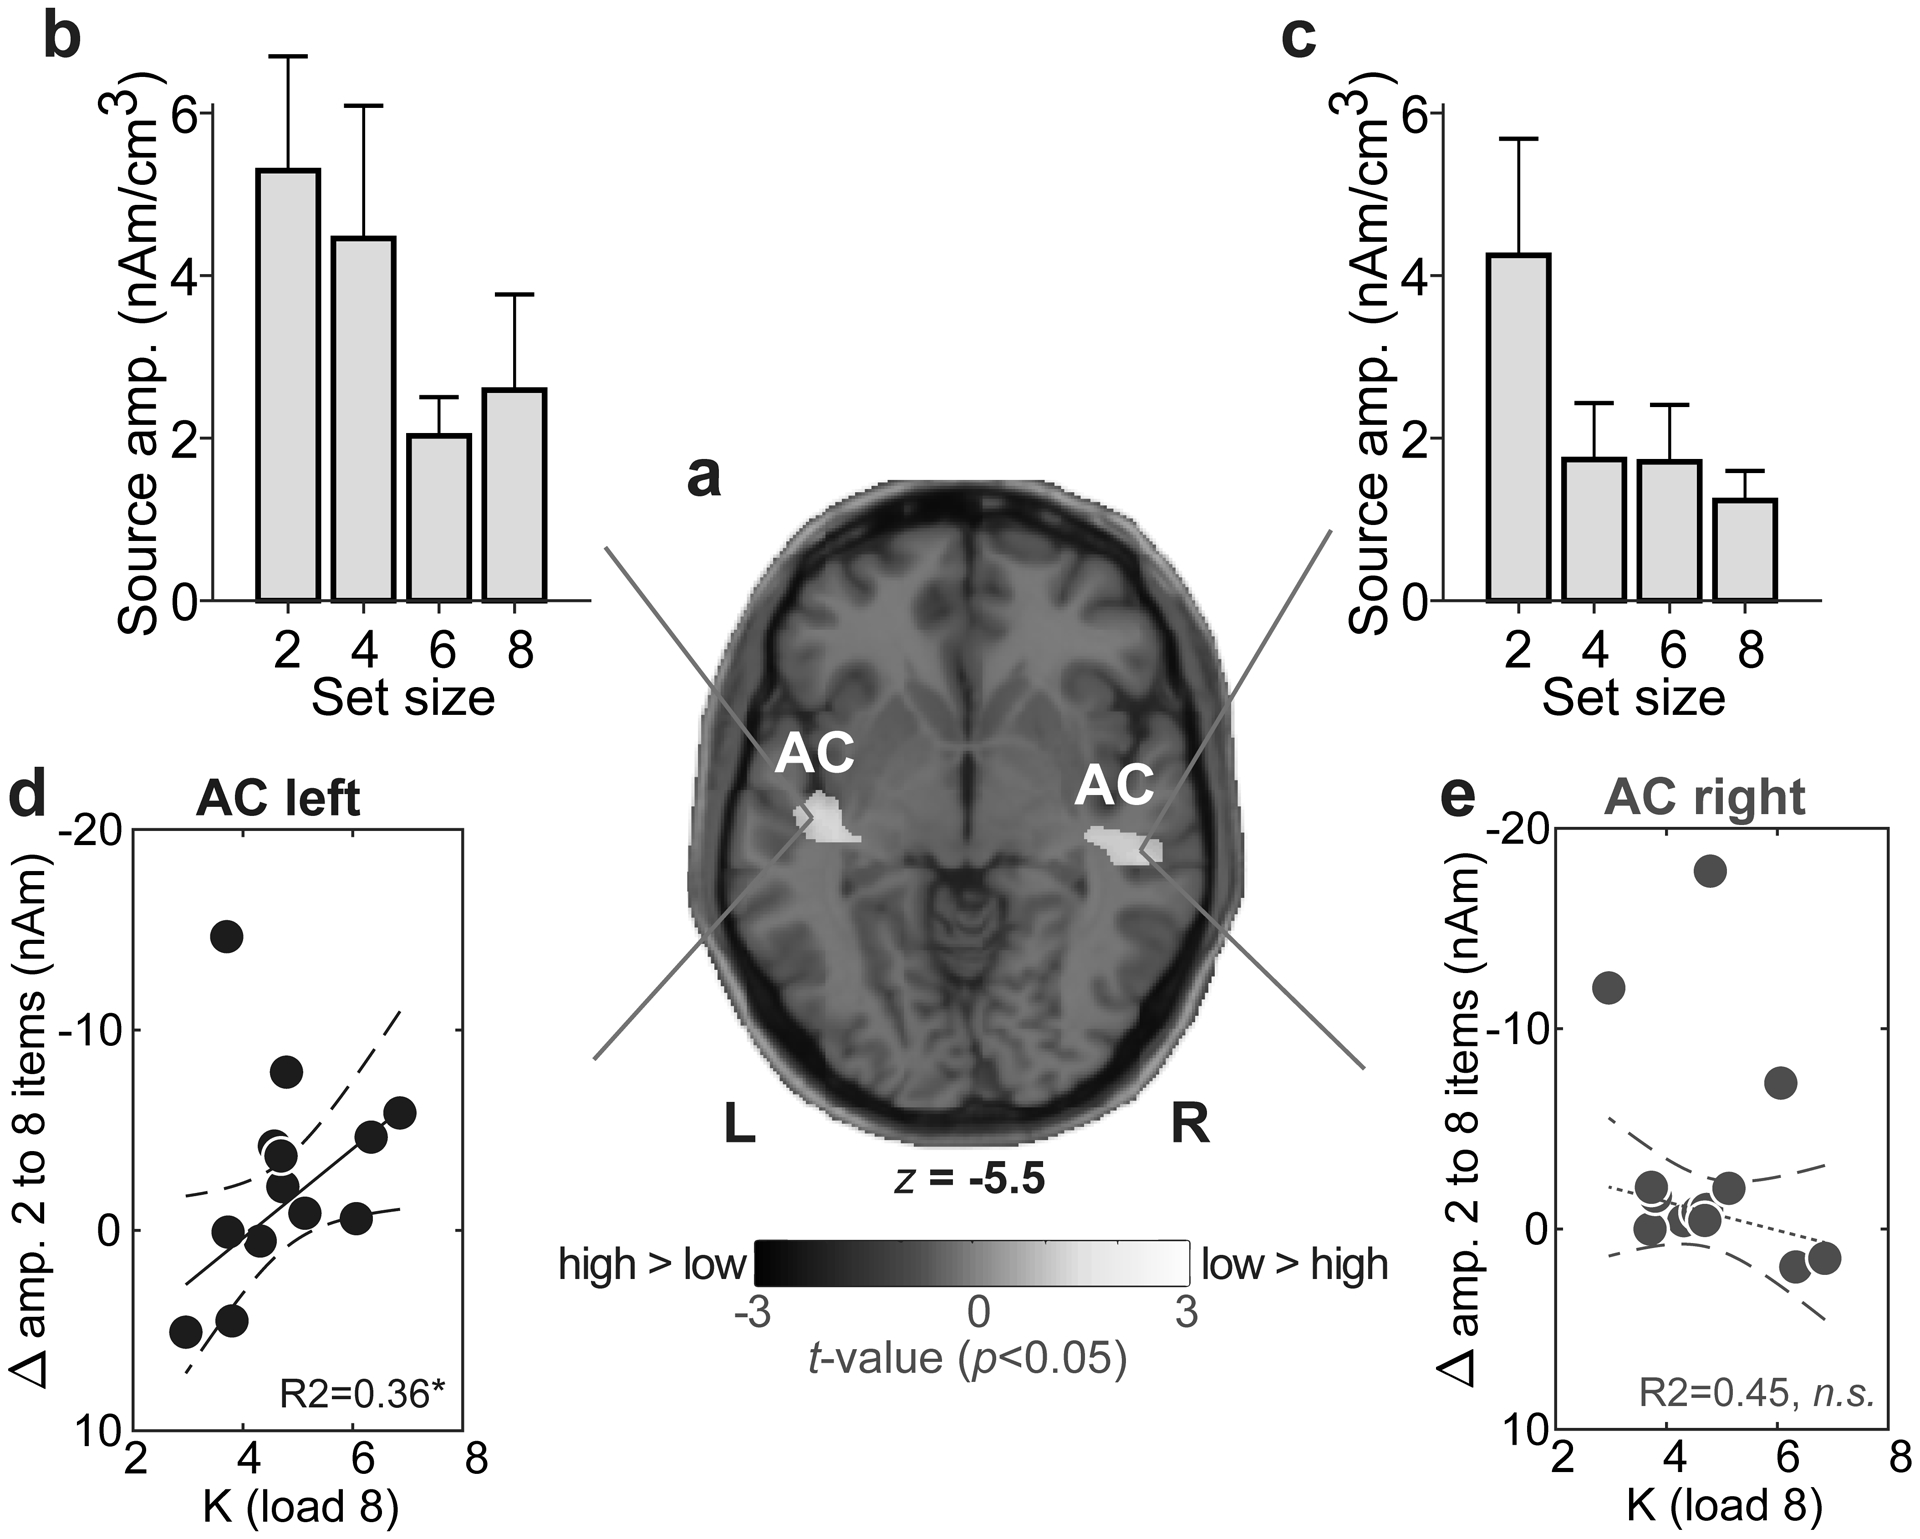
(a) T-stat map contrasting low (2/4) vs. high (6/8) CLARA source activation maps (P<0.05 masked, uncorrected). Functional data are overlaid on the MNI brain template. WM load is distinguished in bilateral Sylvian fissure. (b-c) AC amplitudes vary with set size but load-related changes in left (but not right) AC mirror the pattern observed in scalp EEG (cf. Fig. 2a) (d-e) Maximum behavioral WM capacity (Kload 8) is predicted by AC activity in left hemisphere; individuals with larger changes in source amplitudes with set size have larger WM capacity. No brain-behavior relation is observed in right hemisphere. Dashed lines=95% CI; solid lines, significant correlation; dotted lines, n.s. correlation. *P<0.05. errorbars =± 1 s.e.m.; AC, auditory cortex.