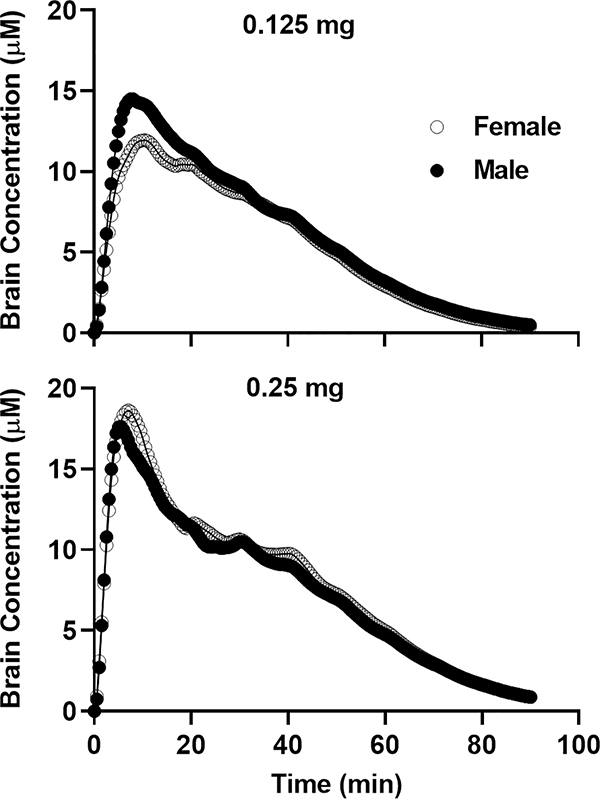
Fig. 5.
Time course of the concentrations of cocaine in the brain during the demand test sessions. The concentrations of cocaine in the brain were calculated with 30-s intervals across the 90-min session. The average of the time courses across rats is shown here. Upper Panel: The time course during the session beginning with 0.125 mg of cocaine. Lower Panel: The time course during the session beginning with 0.25 mg of cocaine.

