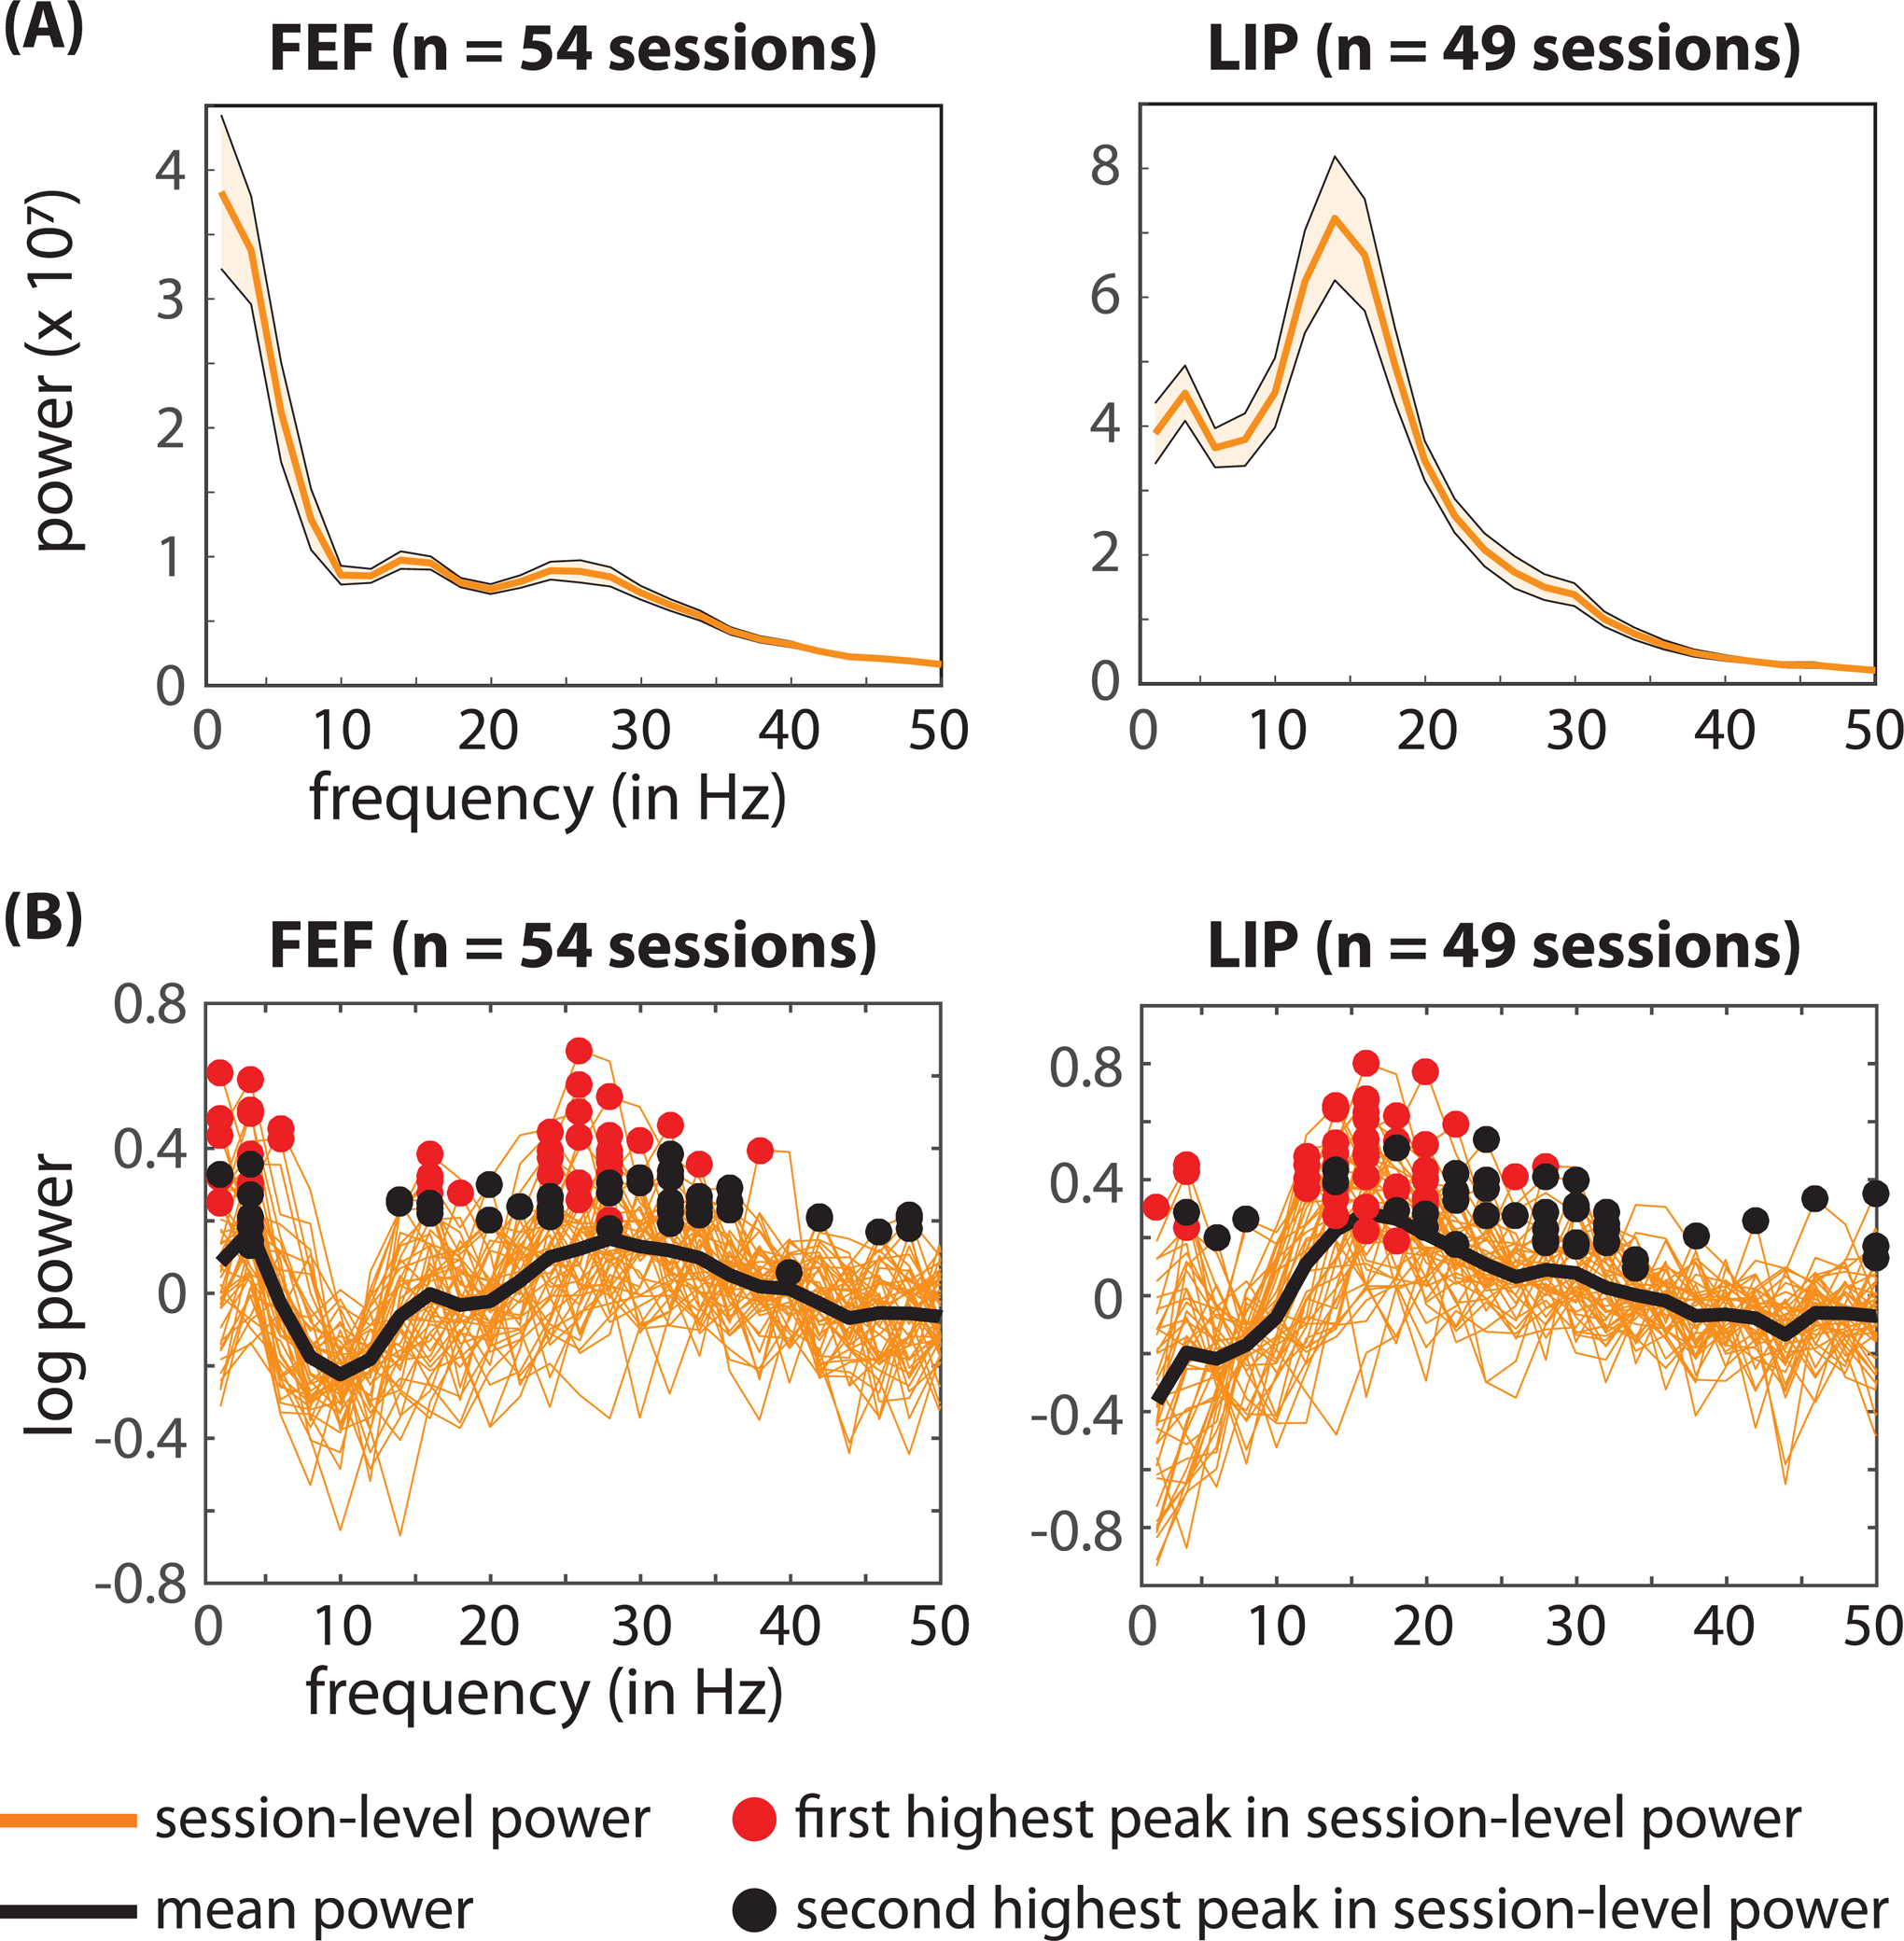
Figure 4. Oscillatory peaks in the power spectra of the local field potentials during the cue-target delay.

(A) The solid orange line represents the mean power spectra, averaged across sessions, when the response fields overlapped with the cued location. The shaded areas around the power spectra represent the standard error of the mean. (B) Shows the isolated oscillatory components for each recording session (solid orange lines). That is, we subtracted a linear fit from the log-transformed power spectra to remove the 1/f background activity. The black line represents the mean across recording sessions. The red and black circles indicate the highest and second highest peaks, respectively, in the power spectra from each recording session. See also Figure S6.
