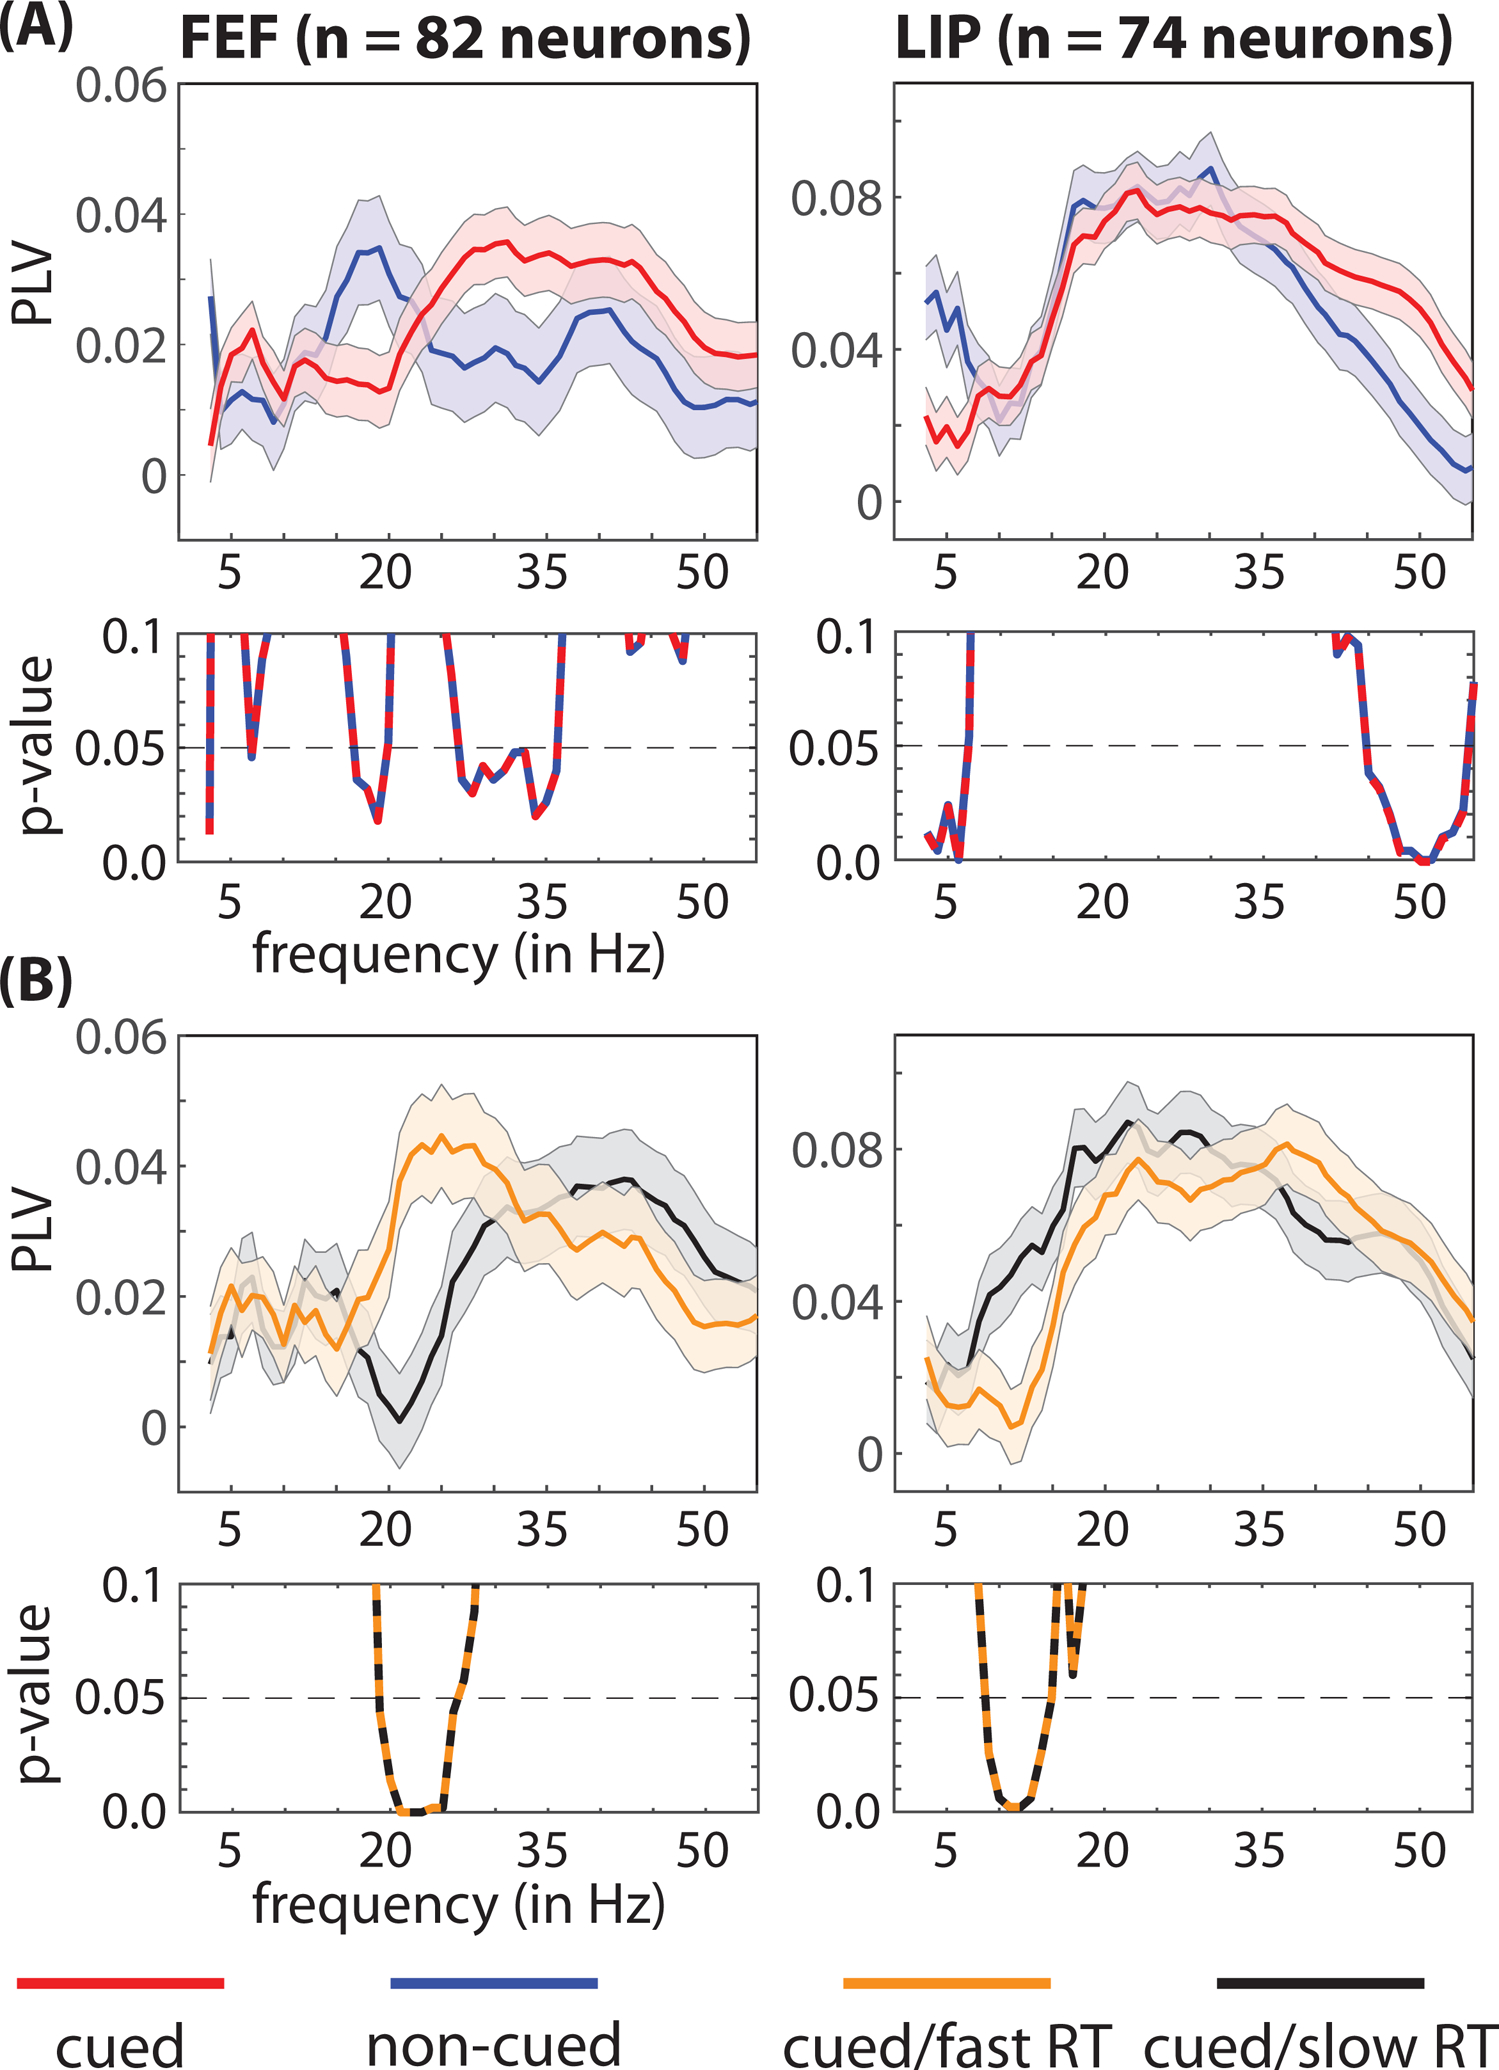
Figure 5. Faster response times are characterized by specific oscillatory patterns in pre-target spiking activity, locally in FEF and LIP.

(A) We observed significant local differences in the frequencies associated with clustering between spikes and oscillatory phase in LFPs (i.e., spike-LFP phase coupling), depending on whether receptive fields and response fields overlapped either a cued (red lines) or a non-cued (blue lines) location. (B) We also observed significant differences between trials that resulted in either faster (orange lines) or slower (black lines) response times (i.e., when receptive fields and response fields overlapped the cued location). The p-values for between-condition comparisons are represented below each panel. The shaded area around each line represents the standard error of the mean. See also Figure S8.
