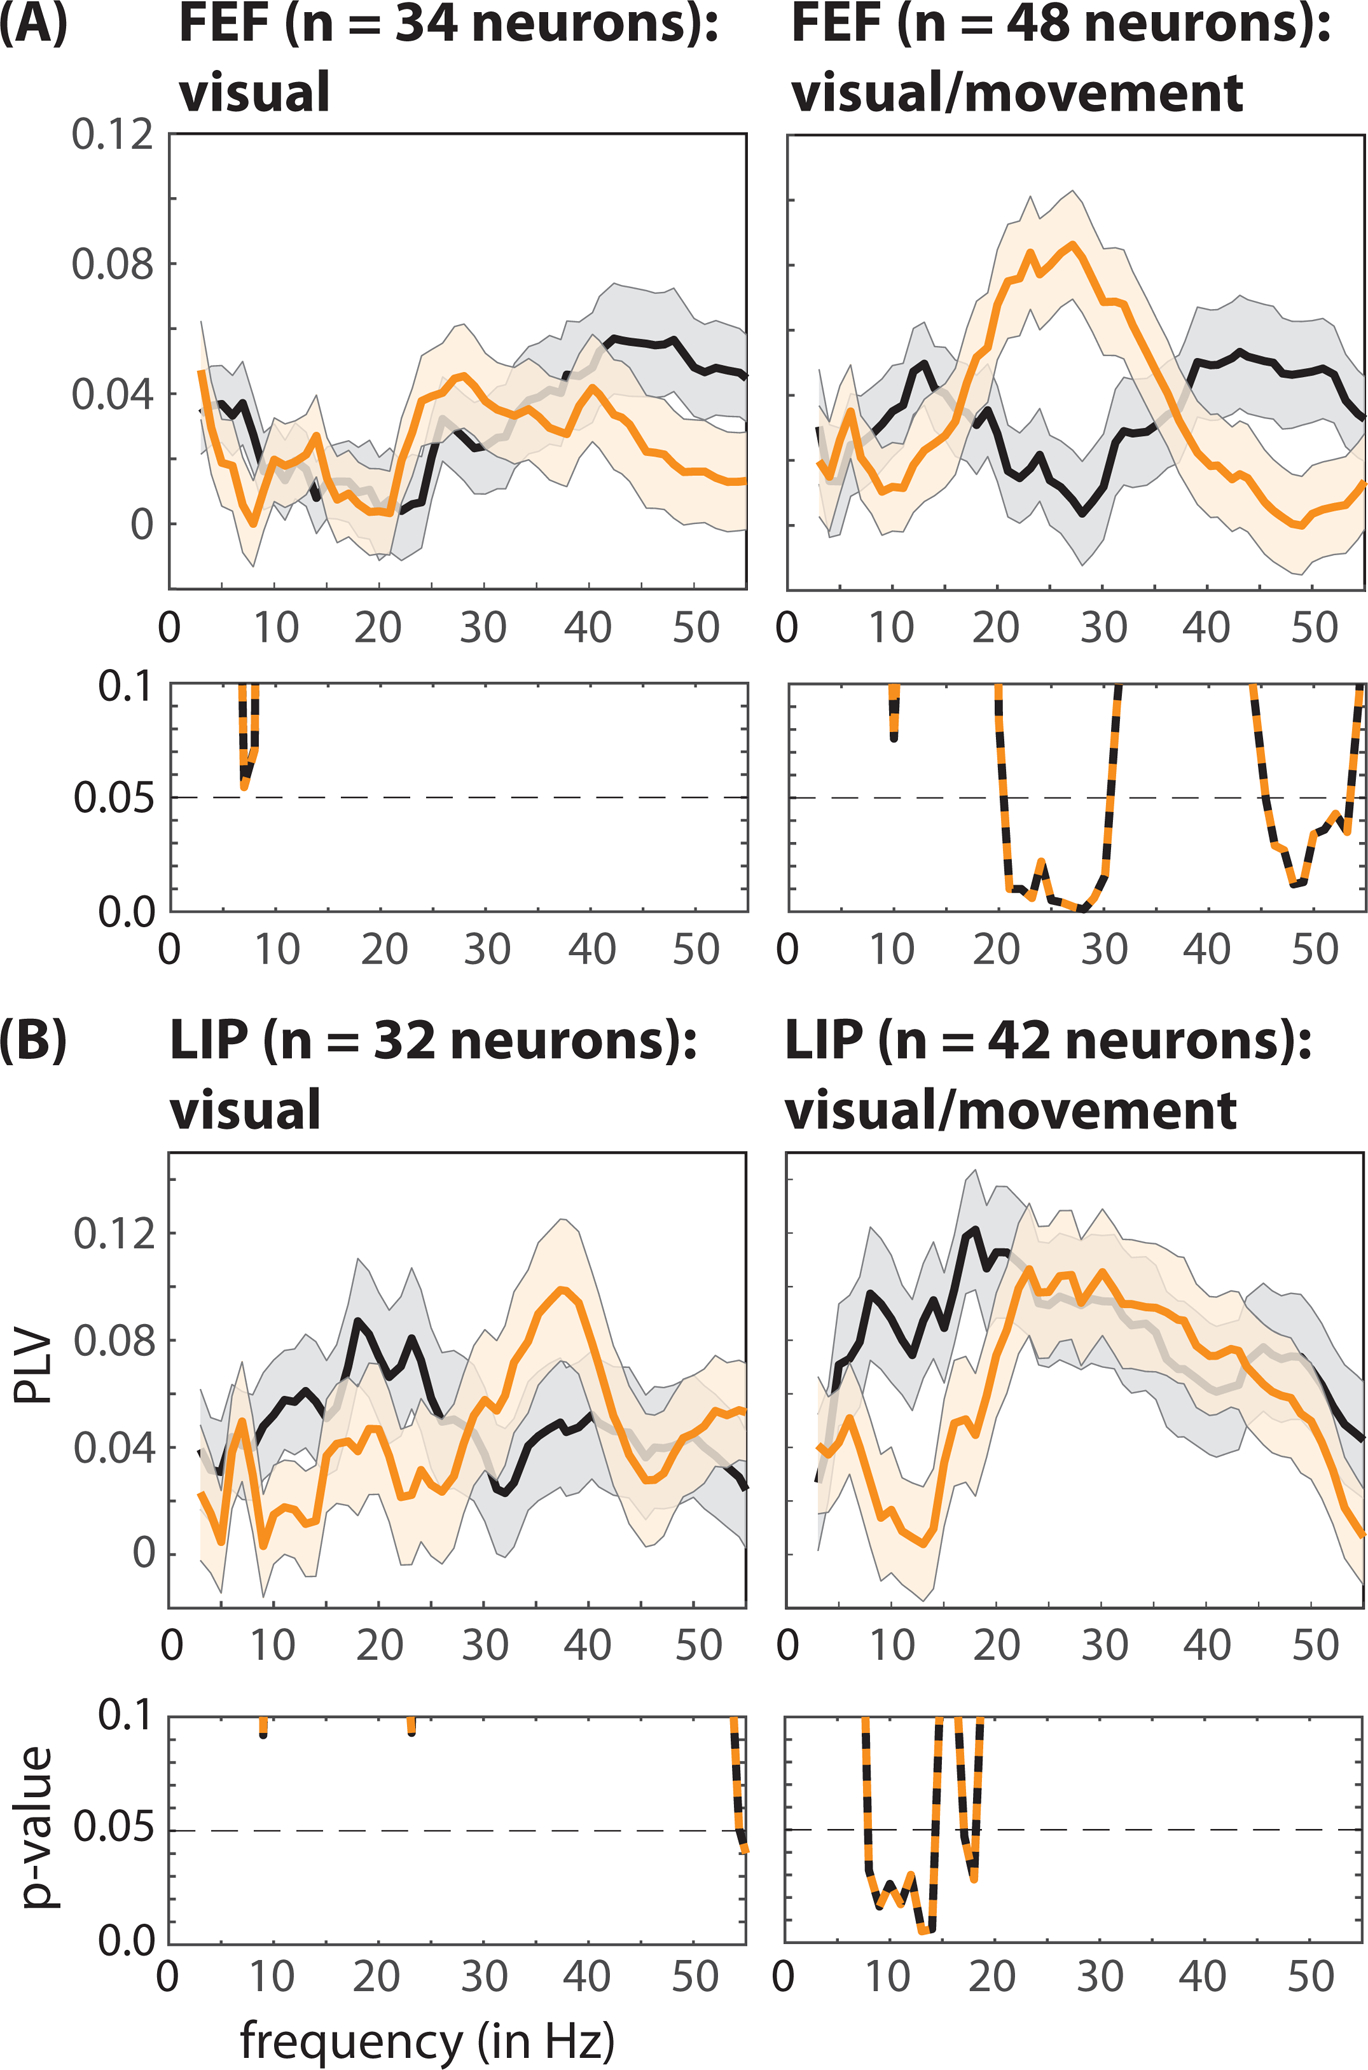
Figure 6. Faster response times are characterized by cell-type specific oscillatory patterns in pre-target spiking activity, locally in FEF and LIP.

In both (A) FEF and (B) LIP, significant differences in local spike-LFP phase coupling between fast- (orange lines) and slow-RT (black lines) trials occurred exclusively among visual-movement neurons (i.e., neurons with both visual-sensory responses and saccade-related activity). The p-values for between-condition comparisons are represented below each panel. The shaded area around each line represents the standard error of the mean. See also Figure S9.
