
Figure 3.
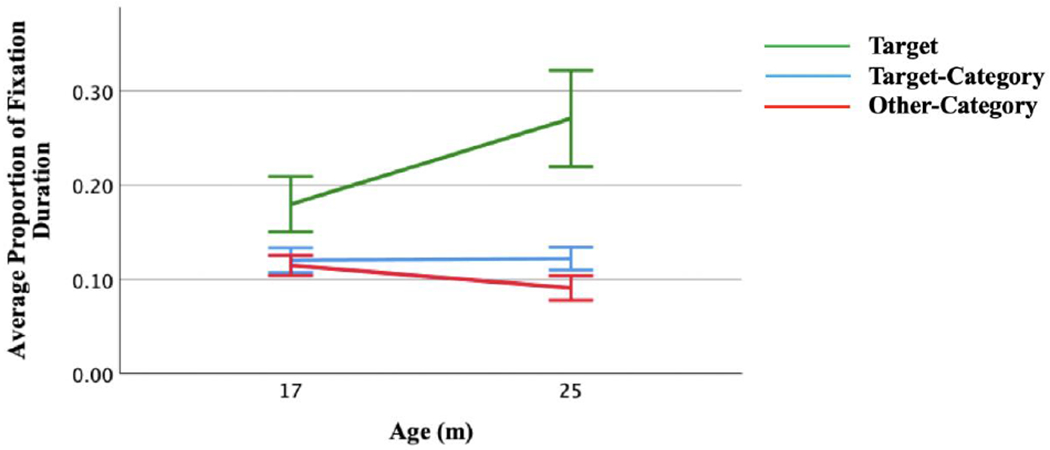
Developmental trajectories of Average Target Fixation, Average Target-Category Fixation, and Average Other-Category Fixation for the longitudinal cohort. Error bars represent: 95% confidence interval.
Official websites use .gov
A
.gov website belongs to an official
government organization in the United States.
Secure .gov websites use HTTPS
A lock (
) or https:// means you've safely
connected to the .gov website. Share sensitive
information only on official, secure websites.
Developmental trajectories of Average Target Fixation, Average Target-Category Fixation, and Average Other-Category Fixation for the longitudinal cohort. Error bars represent: 95% confidence interval.